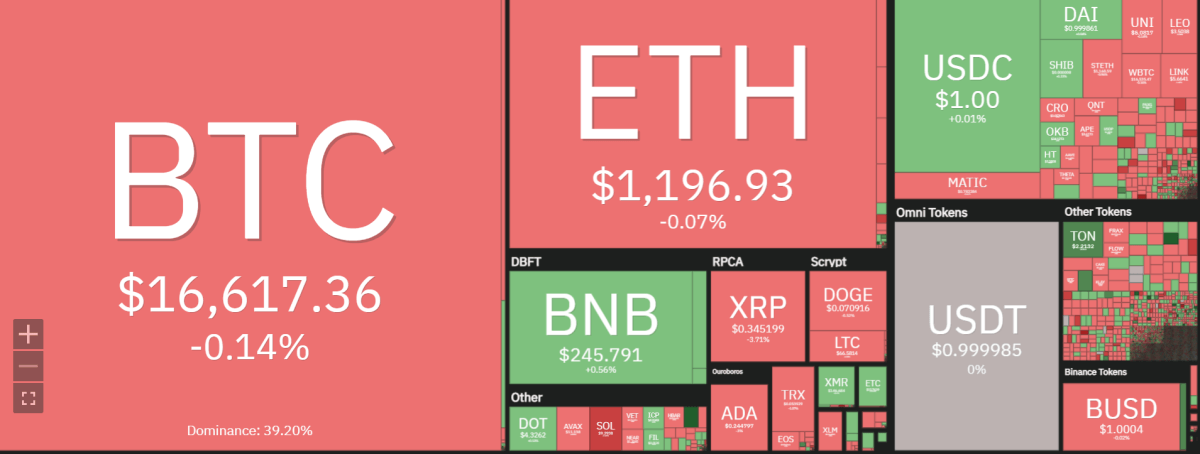
Ethereum price analysis indicates ETH mini rally that was seen last week has been halted at $1,200. The price of Ethereum was seen trading above the $1,100 mark and had made an attempt to break the resistance at $1,200. However, ETH faced stiff resistance at this level which pulled its prices down again. At present, Ethereum is trading around $1,198.03, down 0.03 in the last 24 hours.

Ethereum price analysis is bearish as the overall trend for ETH fails to make any significant gains above the $1,200 mark. The immediate support for Ethereum prices lies at $1,100 which is being tested currently. If this level breaks down, Ethereum prices could continue to fall and reach as low as $1,000 in the near term.
Ethereum price analysis on a daily chart: ETH trades in a bearish range
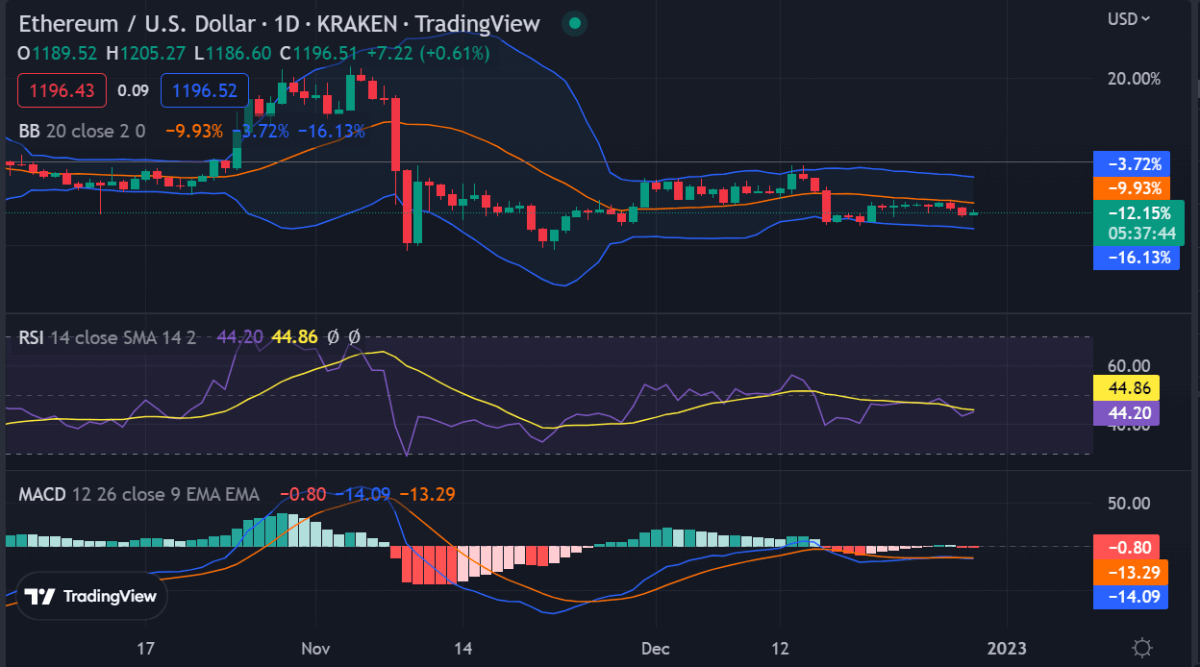
On the daily chart, Ethereum is trading in a bearish range between $1,100 and $1,200. The 50-day moving average (50-SMA) line has crossed below the 200-SMA line indicating that further downside is possible if ETH prices fail to break above the resistance at $1,200 which could cause further losses to the support at $1,100.

On the upside, if Ethereum prices manage to break above $1,200 then it could move towards its next resistance level of $1,300 and beyond. However, any rally is likely to be met with strong selling pressure as traders take profits when ETH reaches these levels.
Ethereum price analysis reveals after a sudden crash below the static support level of $1300, the price has consolidated and formed an ascending wedge pattern after last week’s mini-rally and has failed to break out of the pattern so far. If ETH prices continue to remain below $1,200 then it could extend its losses further toward the lower support at the $1,100 level in the near term.
The Moving Average Convergence Divergence (MACD) is showing a bearish crossover with a negative slope which suggests that Ethereum prices could remain in the range of $1,100 and $1,200 for some time.
In addition, the Relative Strength Index (RSI) is also trading in the bearish zone around the 40 levels, indicating that further downside momentum could be on the cards. Ethereum’s moving average lines are also pointing towards a bearish sentiment.
Ethereum price analysis on a 4-hour chart: ETH stuck in a narrow range
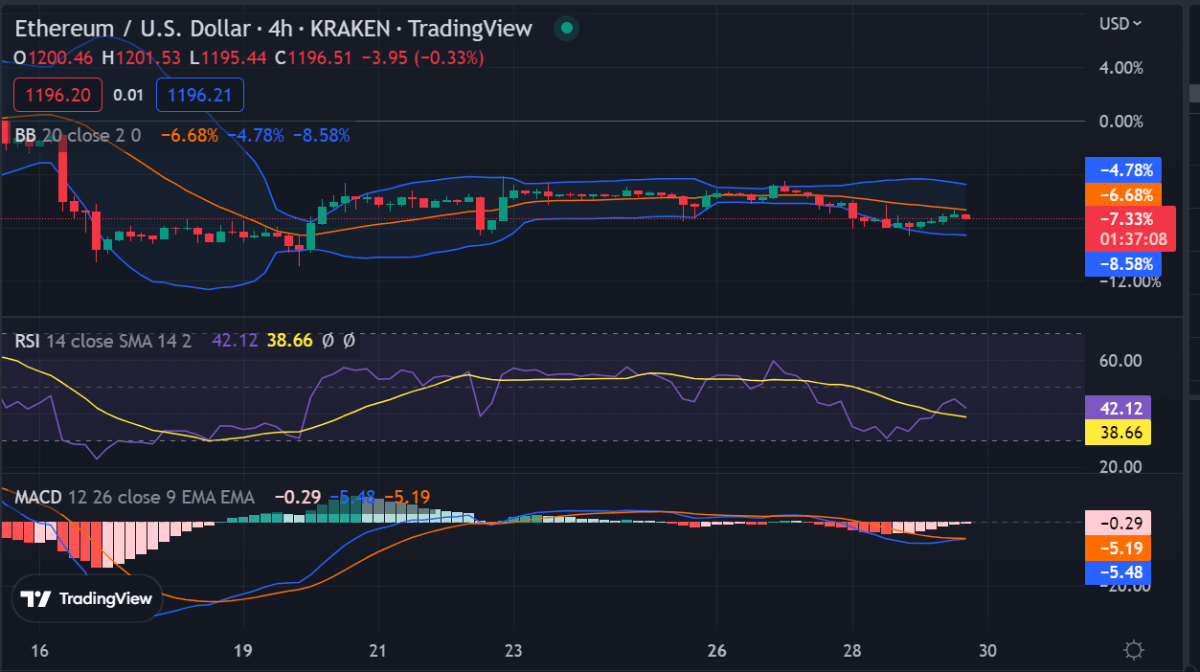
On the 4-hour chart, Ethereum price analysis shows ETH prices are stuck in a narrow range between $1,190-$1,200. Ethereum has been trading in bearish bias, as the 14-period Relative Strength Index (RSI) is trading below the 50 levels. The MACD line has also crossed below the signal line indicating a bearish sentiment in Ethereum prices.

The immediate resistance for ETH is placed at $1,200 and if it fails to break above this level then a further downside could be expected toward its support at $1,100.The Stochastic RSI is also trading near the overbought region which could lead to further selling pressure and pull Ethereum prices down.
Ethereum price analysis conclusion
Ethereum price analysis shows ETH started an uptrend and reached the 50-day moving average line at $1236 after touching the lower boundary. Additionally, the 50-day moving average line appears alongside the descending channel’s middle boundary, making this level a significant impediment.
Ethereum bulls can anticipate an uptrend toward the upper trendline of the wedge if they surpass this pivotal resistance zone. Nonetheless, taking into account recent price action and diminished bullish momentum, it is more probable that there will be a rejection from this level.
If Ethereum prices fail to break above the resistance and continue to remain in the bearish range then it could experience further losses toward the $1,100 support level.
While waiting for Ethereum to move further, see our Price Predictions on XDC, Cardano, and Curve


