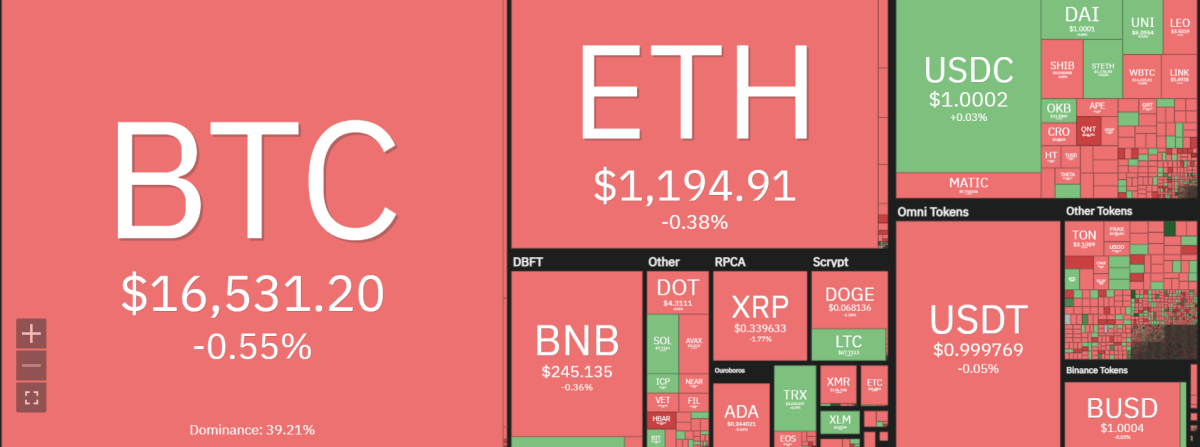
Bitcoin is trading at $16,546.74, down 0.56 percent in the last 24 hours, according to our recent Bitcoin price analysis. Bitcoin’s trading volume has declined slightly in the last 24 hours, underlining the continuing lack of direction. The trading volume is down to $15.1 billion, while the market cap stands at $318.4 billion.

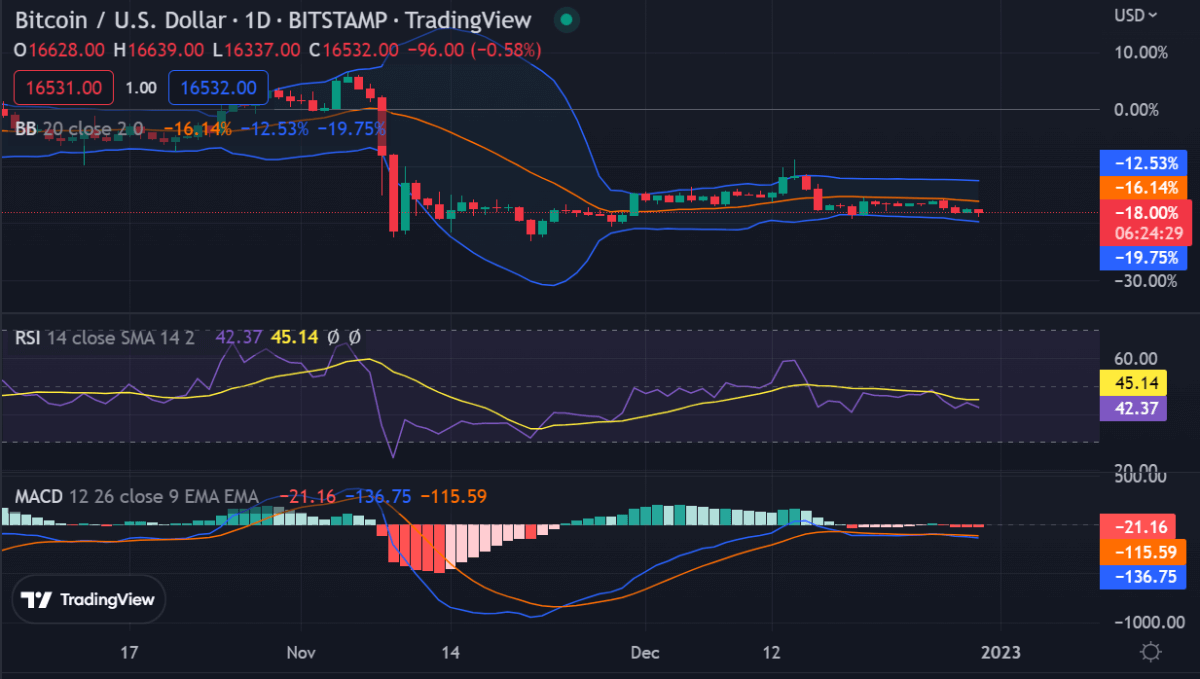
The Bollinger Bands width is pointing to low volatility levels, further confirming that Bitcoin price action will remain subdued for the foreseeable future. The 30-day moving average (MA) still remains above $16,000 and provides strong support for BTC prices.
Bitcoin price analysis shows that BTC price is encased in a tight range between the 50-day moving average and an ascending trendline, making it pivotal for traders to pay attention to this range. The direction that prices break out of this corridor will be indicative of what lies ahead in terms of mid-term trends for BTC.
The fundamental analysis illustrates that BTC is currently in a bearish market as the U.S. Federal Reserve tightens, there are no leverage buyers need, and fearful BTC options traders are pervasive. Market analysts are bearish on BTC, with few bullish allies as 2023 looms.
BTC/USD price action on a daily chart: Bearish outlook with few bullish allies
Bitcoin price analysis on the daily timeframe reveals despite the lack of fundamental drivers, BTC has managed to remain above a crucial support level at $16,000. The 50-day moving average (MA) currently stands at $15,979 and is providing a strong cushion for BTC prices. If this support fails then we could see BTC prices move further south.

On the upside, BTC faces significant resistance at $18,000 as bulls are having a difficult time pushing beyond this level. The Bollinger Bands width is pointing to low volatility levels and this could mean that Bitcoin price action will remain subdued for the foreseeable future unless there is some sort of catalyst to spark a new rally.
The BTC/USD pair has been trading within a range between $16,500 and $18,000 since mid-November. The bulls failed to break the resistance barrier at $18,000 which in turn caused the price to retreat back toward the short-term support level around the 200-day MA at $16,624.86.
The Fibonacci retracement tool shows the next support level lies at $16,250, while a break above the resistance at $18,000 could see prices test the psychological level of $20,000.
The Relative Strength Indicator (RSI) is currently hovering around the neutral 50 mark and suggests that market sentiment is flat. We may see BTC prices consolidate further until a clear breakout occurs from the current trading range.
The Stochastic RSI is also pointing to a bearish trend and the bears still have control of the market while the Moving Average Divergence Convergence (MACD) is falling and the signal line has crossed below the red signal line, further indicating a bearish trend.
Bitcoin price analysis on a 4-hour chart: Bulls defend crucial support
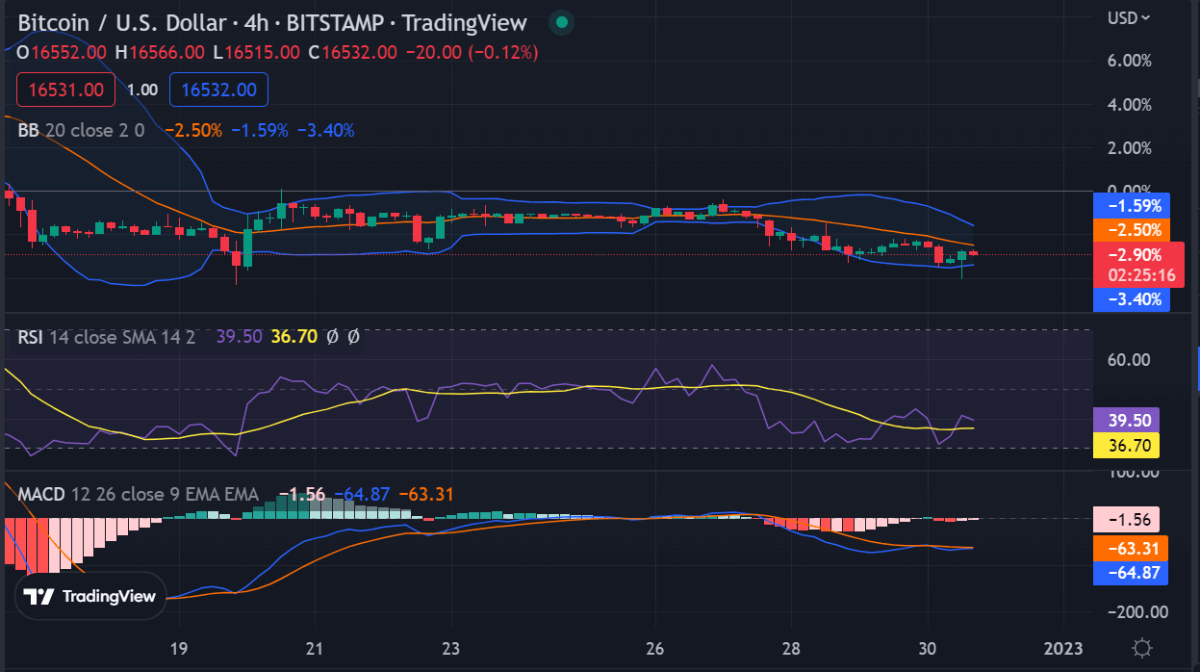
Bitcoin price analysis shows the bulls have managed to remain above $16,500 as the dormancy in the market continues. The 4-hour chart shows that BTC prices have been trading within a tight range and if the bulls manage to break out of this, we could see a new rally take shape.

The 50-day moving average (MA) has been providing strong support at $16,000 while the 200-day MA is currently hovering around $16,624.86. The bulls must defend this crucial support level or else we could see BTC prices fall further south.
A bullish crossover on the MACD could indicate that the bulls have taken control of the market and could trigger a new rally as the MACD line is on the verge of crossing above the signal line. The RSI is currently neutral at 50 while the Stochastic RSI is also pointing to bearish conditions, indicating that prices are likely to remain range-bound.
The EMA ribbon and the Ichimoku Cloud both indicate that BTC is in a bearish trend, with the Kumo Cloud providing dynamic resistance at $18,000. If the bulls manage to break above this level, then we could see Bitcoin prices surge toward $20,000.
Bitcoin price analysis conclusion
Overall, Bitcoin price analysis shows that the BTC/USD pair is currently in a consolidation phase and could remain range-bound for the foreseeable future. The bulls must defend the crucial support at $16,500 or else we could see Bitcoin prices move further south. On the upside, BTC faces significant resistance at $18,000 and must break above this level before any rally can take shape.
While waiting for Bitcoin to move further, see our Price Predictions on XDC, Cardano, and Curve


