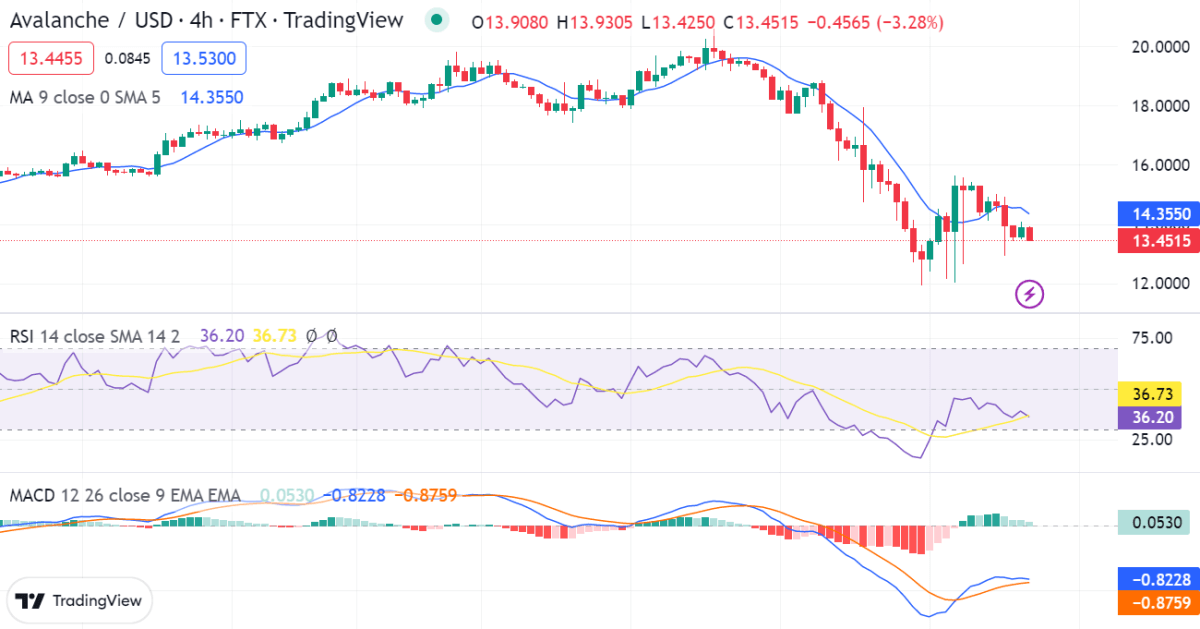
Avalanche price analysis shows a downward trend as the AVAX/USD price is trading below the support level. The token has been trading in a tight range, with prices ranging between $10.9 and $11 throughout the day, although today the bears have taken control of the market as prices have dropped to $10.88, a new low for the day. As a result, AVAX/USD has broken below the support level of $10.67, which has been a major hurdle in the past. The technical indicators are bearish and could indicate further downside in the near term.
Avalanche price analysis 1-day price chart: AVAX further declines below $10.88
The 24-hour Avalanche price analysis shows that the AVAX/USD pair is trading in the red and has dropped over 0.87% in the last 24 hours. The token has been struggling to break above the $10.99 resistance level, but volume has been decreasing as buyers have been unable to push the price higher. Furthermore, AVAX/USD is also trading below the 50-day moving average and the 200-day moving average, which could indicate that bears have a stronger grip on the market.

The relative strength index (RSI) is currently at 52.50, which shows that the market is neither oversold nor overbought. Moreover, the moving average convergence and divergence (MACD) has also seen a bearish crossover and has moved into negative territory. Since the MACD line (blue) is below the signal line (red).
AVAX/USD 4-hour price chart: The price curve descends to an end at $10.88
The hourly Avalanche price analysis reveals that the AVAX/USD pair is trading in a bearish trend and has found strong resistance at the $10.99 level. The token has dropped to a new low of $10.88, and if the bears remain in control, we could see AVAX/USD fall further. The technical indicators are bearish and could point to further downside in the near term.

The RSI currently has dropped below 50 and is moving towards oversold levels, indicating that selling pressure is increasing. Furthermore, the MACD has seen a bearish crossover and is signaling that the bears are in control. The moving average has also dropped below both the 50-day and 200-day MA, which could indicate further downside in the near term.
Avalanche price analysis conclusion
Overall avalanche price analysis shows that the AVAX/USD pair is trading in a bearish trend and has broken below the critical support level of $10.67. The technical indicators are bearish and could point to further downside in the near term. Traders should watch for a break above the $10.99 level, which would indicate that bulls are attempting to take control of the market.


