Dogecoin price analysis indicates bullish momentum has resumed on the second day of the new year after a period of consolidation. Dogecoin is trading at $0.07195, up by 3.36 percent in the last 24 hours. Dogecoin’s trading volume has seen a steady rise, reaching $336,406,016t 24 hours, with major exchanges such as Binance leading the way. The Dogecoin price has broken out from a previous resistance zone at $0.065 and is currently aiming for a new target of $0.076, with strong bullish momentum continuing to be seen across the board.
Analysts believe that if Dogecoin continues to perform in this manner and maintains its price above the $0.07 level, it could see further gains in the near future. This could mean a strong start to 2023 for Dogecoin, with some speculating that it could potentially reach all-time highs of $0.10 in the next few days. The Dogecoin market has grown substantially over the past few months, with many new investors joining the fray and driving prices up . This trend is likely to continue into the new year and could help Dogecoin reach its goal of becoming one of the top digital currencies.
Dogecoin price analysis on a daily chart: DOGE price trades above the 50-day EMA line
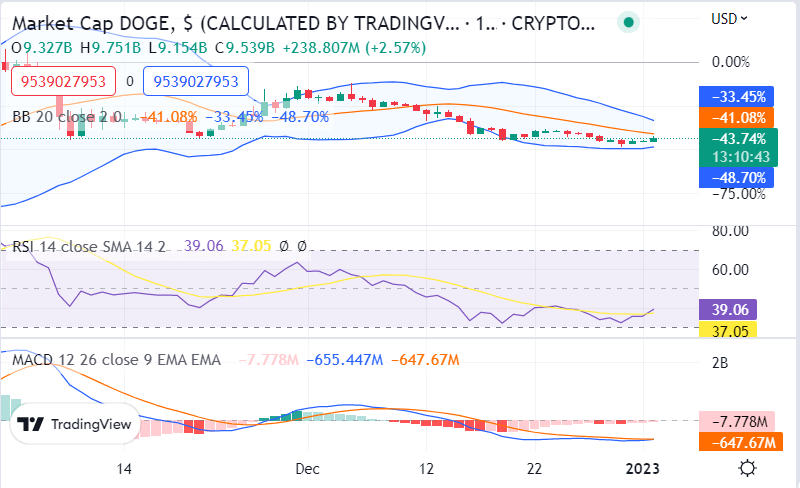
Dogecoin price analysis on a daily chart reveals Dogecoin opened the daily trading session at intraday lows of $0.14 and moved towards the resistance of $0.18, forming a bullish pattern as it trades above the 50-day exponential moving average (EMA) line. The 200-day EMA line crossed over the 50-day EMA, signaling that a bullish trend has been established and that the price is likely to move higher in the coming days.

The Fibonacci retracement levels also show that DOGE is trading between the 38.2% and 50% Fibonacci retracement levels, indicating a possible upward price trend ahead. Furthermore, the RSI (relative strength index) indicator has moved above the 50 levels, suggesting that bulls are gaining control of the market and that a strong uptrend may form.
Looking at further technical indications, DOGE is trading in a consolidation pattern, with the 50-day EMA line and the 200-day EMA line forming a converging trend. This trend forms when short-term averages are gradually converging toward longer-term averages, suggesting that a breakout may be imminent.
Dogecoin price analysis on a 4-hour chart: Volatility increases
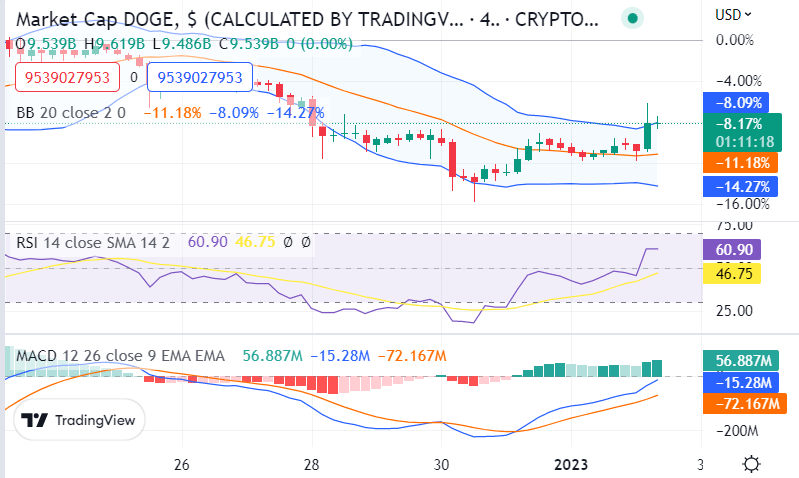
Dogecoin price analysis on the 4-hour chart shows DOGE prices have made significant price changes over the last few hours, with prices ranging from $0.06936 to as high as $0.07236. The Bollinger Bands indicator also indicates a high level of volatility, with the upper and lower bands diverging rapidly as DOGE prices make sudden movements. In addition, the Relative Strength Index (RSI) has been steadily increasing, and currently sits at an elevated level of 59, indicating that the asset is currently near the overbought region.
Dogecoin is likely to face rejection at the current levels, and the price could drop to $0.06936 if traders take profits from the current overbought region However, if bulls are able to maintain control, Dogecoin could break out of the current resistance level of $0.07236 and test higher levels.

Such a breakout would open up the door for an eventual test of $0.085, which is a crucial resistance level that Dogecoin has been unable to breach since mid-November.
Further technical analysis suggests that a sustained move past the $0.085 resistance would open the door for Dogecoin to extend its rally toward $0.10 and possibly beyond that. The MACD is well placed above the red signal line, indicating that the bulls are likely to remain in control.
Dogecoin price analysis conclusion
Dogecoin price analysis shows that Dogecoin appears to be in bullish momentum. With further technical analysis, the possibility exists for Dogecoin to extend its rally toward $0.10 if the current resistance of $0.085 is broken. The key support levels for Dogecoin currently remain at $0.07 and $0.055, respectively, and breaking these supports could signal a reversal of the trend and a possible bearish future for Dogecoin.


