Ripple price analysis shows strong bullish momentum, as XRP has jumped to $0.3513, up from a low of $0.3216 over the past 24 hours. The crypto coin has been trading in an uptrend since earlier today as the market opened trading in bearish territory, However, the cryptocurrency has now reversed its trend and started trading in a bullish manner.
The price chart shows strong resistance for XRP/USD at $0.3539. This is a clear indication that buyers are interested in buying up this digital asset as it continues to climb higher. On the downside, support for XRP can be found at the $0.3216 level. This is an important level as it shows that buyers are still interested in buying up the asset even at lower prices.
The other cryptocurrencies have also been performing well, with Ethereum (ETH) rising to a high of $1,216. Bitcoin (BTC) has also risen to a new all-time high of above $16,697 per coin. These developments are likely to have a positive impact on the price of XRP as its follows suit and continues the bullish momentum.
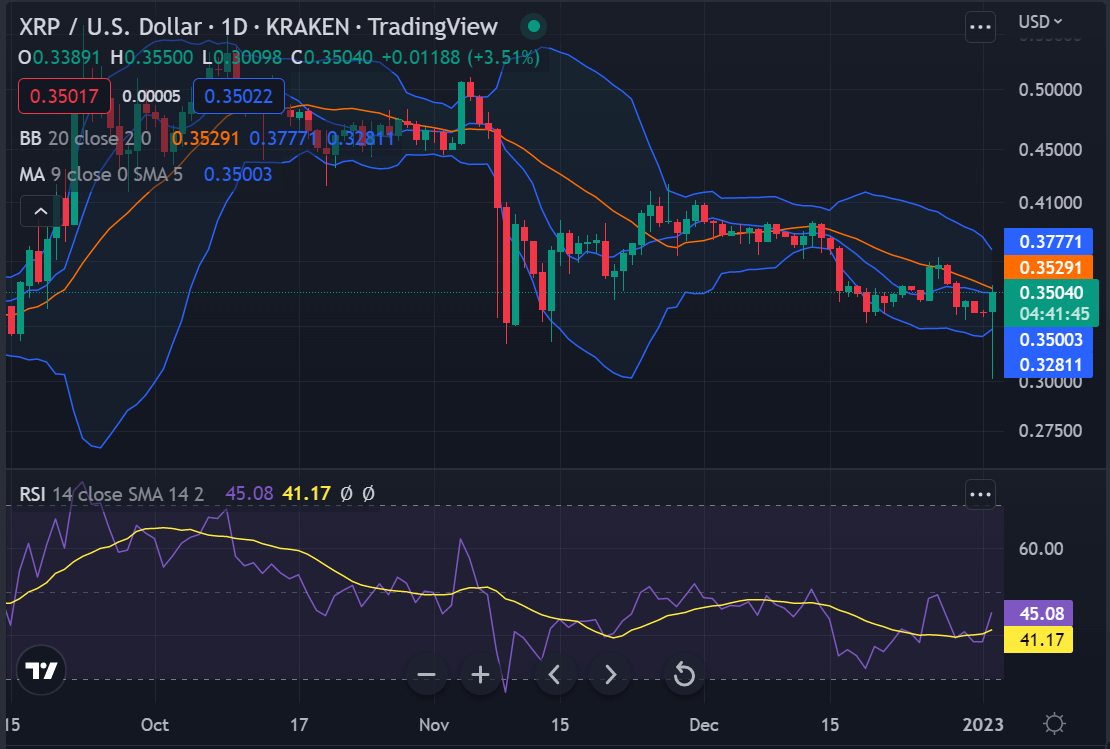
XRP/USD 1-day price chart: Tremendous increase in price as bulls regain momentum
The daily Ripple price analysis is giving the bulls a lead as the price levels jumped to $0.3513 after a strong bullish rally. This has surprised the analysts and turned many towards the buying side after the sudden shift in the market trend. The coin gained a good 3.51 percent value during the last 24 hours. The calculated moving average (MA) over the past 24 hours has been $0.3484, which is a positive sign as the coin is over that mark now.

The volatility for the candlestick chart is gradually increasing as the upper limit of the Bollinger bands reaches the value of $0.37, and the lower one goes down to the $0.32811 level. At the same time, the price has shooted past the upper band, which is a strong bullish indication. The Relative Strength Index (RSI) is showing a score of 41.17, which is moving towards the over-bought limit, as the past week has been favorable for cryptocurrency, and an overwhelming buying activity has taken over the market today.
Ripple price analysis: Recent developments and further technical indications
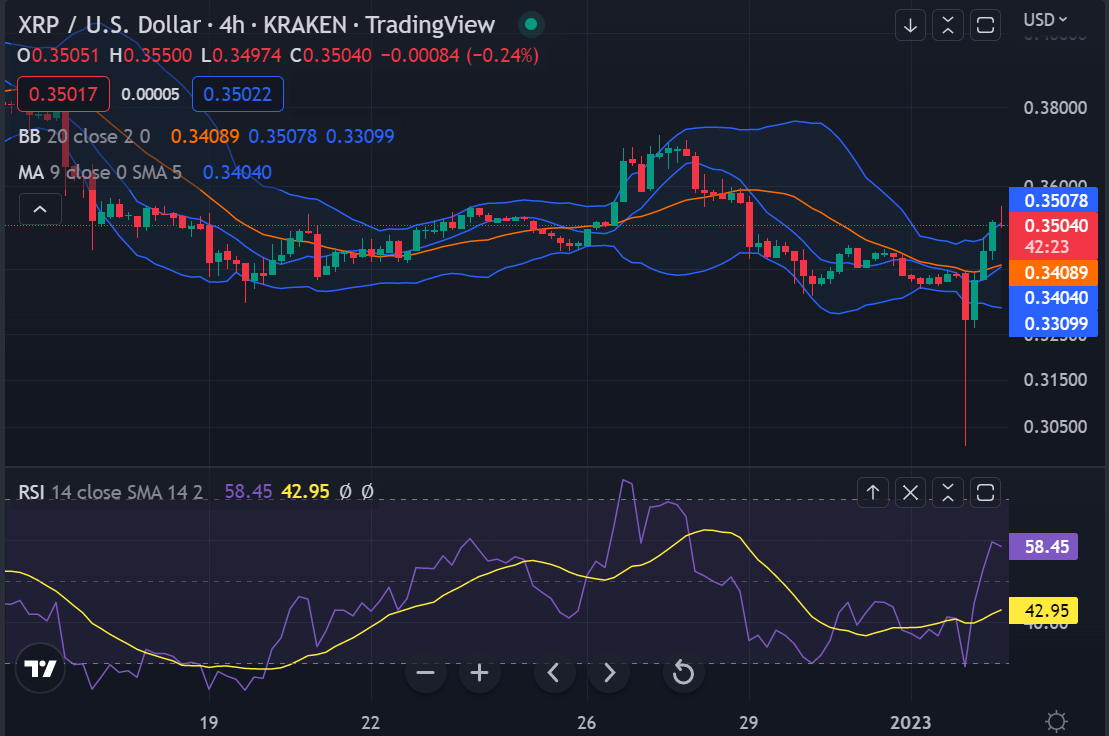
The 4-hour Ripple price analysis shows a sharp increase in the XRP coin value as the price has reached $0.3513. The weekly analysis is also in favor of bulls as it tells that the buyers have dominated the market and helped the cryptocurrency rise slowly. Today’s case has proved to be the same, rather much more overwhelming, as the Moving Average (MA) has moved up to $0.340.

The future trends can be positive for the buyers, as the volatility is increasing in the candlestick chart. Meanwhile, the values of the Bollinger bands are as follows; the upper value is at the $0.3507 mark, whereas the lower value is present at the $0.33099 mark. The RSI score is 42.95 in the 4-hour chart, which may raise more in the future depending upon the circumstances.
Ripple price analysis conclusion
From the above Ripple price analysis, it can be inferred that today’s trend has proved to be in favor of the buyers as the price levels increased tremendously to $0.3513 during the day. Both the 1-day and 4-hours price charts have been showing strong support for cryptocurrency, as the price function has been headed upward for the last 8 hours.


