Avalanche price analysis could be changing trends at current viewing, as price receded more than 3 percent over the past 24 hours to move as low as $14.89. This happened after AVAX price touched a month-long high of $16.38 yesterday to conclude an uptrend that initiated on January 2 with price then at $10.74. Following what was almost a 50 percent rise at the start of this year, Avalanche price could now be set for a correction as short sellers look to reap out profits. At the time of writing, price is set at $15.45 with a market capitalisation of $4,811,785,911 and ranked 17th in the market.
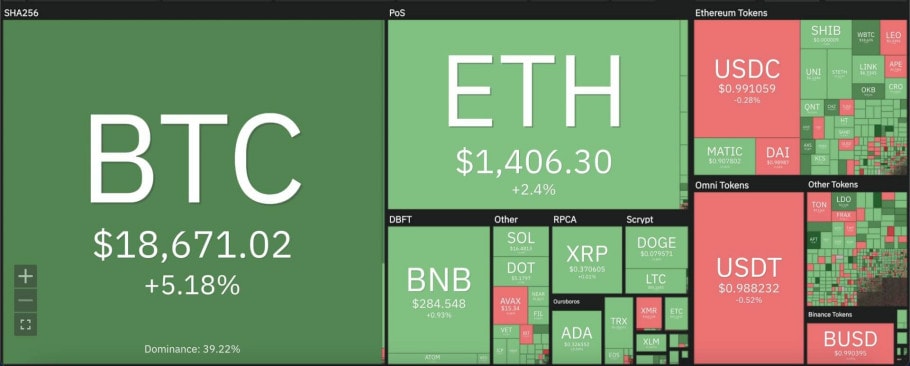
The larger cryptocurrency market continued to trend upwards, as Bitcoin cleared the $18,500 mark with a further 5 percent increment. Ethereum followed suit, rising 3 percent in moving above $1,400. Meanwhile, among Altcoins, Ripple stayed at $0.37, whereas Dogecoin rose 3 percent to move up to $0.07, and Cardano made a similar increment to move up to $0.32. Additionally, Polkadot upped 2 percent at $5.18 and Solana 1 percent to move up to $16.48.

Avalanche price analysis: RSI slides down after moving into overbought region
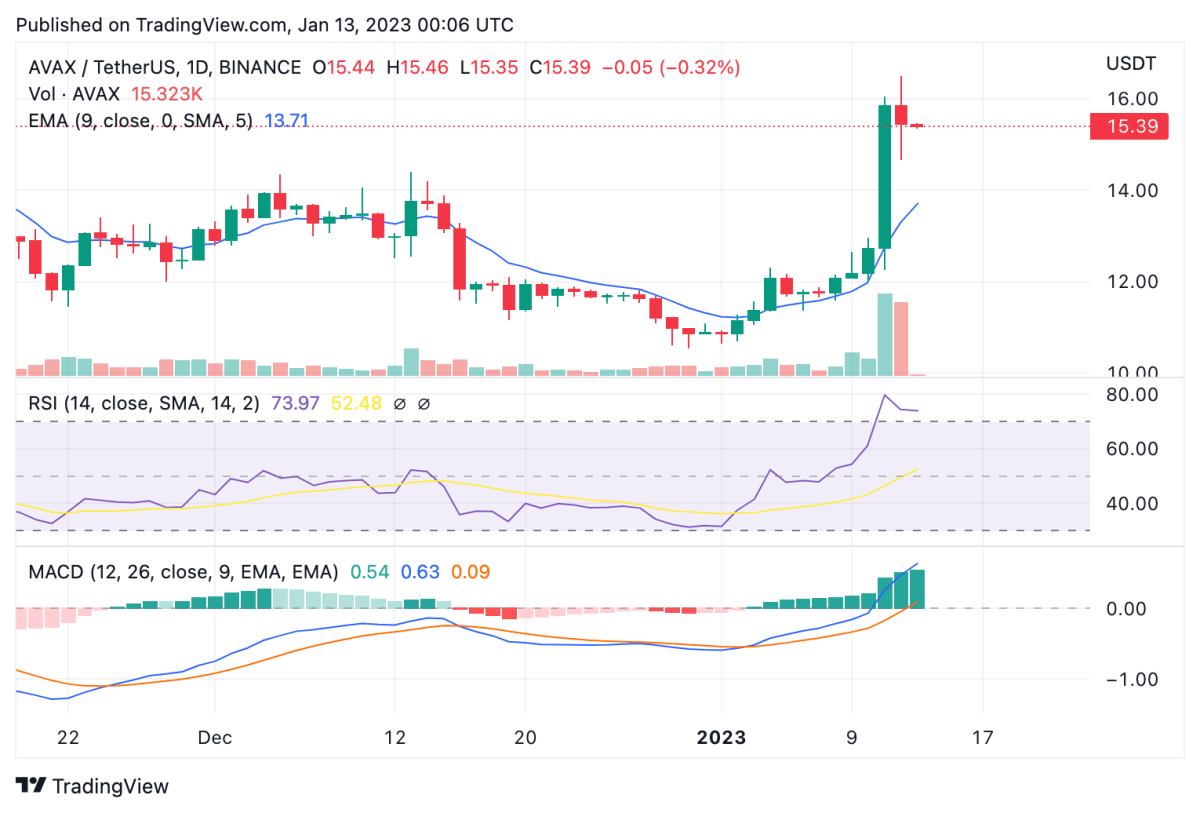
On the 24-hour candlestick chart for Avalanche price analysis, price can be seen extending into an ascending triangle pattern till yesterday, before reversing trend earlier today, indicated by an Evening Star pattern. Volatility rose extensively over the past 24 hours, as price corrected down to $14.62 and could potentially move back to current support at $13.50. However, current price stays above the 9 and 21-day moving averages, along with the 50-day exponential moving average (EMA) at $13.70.

The 24-hour relative strength index (RSI) epitomises the current price correction, as it extended into the severely overbought zone above the 80 mark yesterday. However, the RSI moved downwards swiftly after, currently sitting at 73.61 and continuing to move downward. Meanwhile, the moving average convergence divergence (MACD) continues to show a bullish divergence in place according to the recent price movement.
Disclaimer. The information provided is not trading advice. Cryptopolitan.com holds no liability for any investments made based on the information provided on this page. We strongly recommend independent research and/or consultation with a qualified professional before making any investment decisions.


