The Avalanche price has slightly dropped again today as the bears took charge of the market once again, as per Avalanche price analysis. After the continuous bullish activity of the last three days, the price function has imbalanced again, and the price has been lowered up to the $15.85 level. The bears are thus maintaining their lead at present after making a comeback and a difference in the price ratio. It can be expected that the cryptocurrency might face further loss in the upcoming hours if the bearish pressure persists. On the other hand, as we saw yesterday, there are eminent chances of a trend reversal in favor of the bulls.
The cryptocurrency is down by 6.21 percent in the last 24 hours, as per Avalanche price analysis. However, it is still trading above the support level of $15.75 with a market capitalization of $4.94 billion and 24-hour volume traded standing at $440 million.
Avalanche price analysis 1-day price chart: Price yet trading in red
The 24-hour Avalanche price analysis shows that an abrupt fall in AVAX/USD price has been recorded in the last 24 hours, as the price descended to $15.85. Although the trends varied continuously in the past few weeks, today’s trend has proved highly supportive for the bears. At the same time, the bullish activity of the last few days has enabled the coin to report a profit of 2.96 percent for the last week, which hints at the bullish tendency of the cryptocurrency as the coin was at a loss previously. The moving average (MA) is present at the $16.30 level in the one-day price chart.

The volatility has been decreasing. Hence it can be expected that the current correction may not last long. The Bollinger Bands Indicator dictates the following values for the day; the upper value is $18.50, while the lower value is the $9.00 mark. The Relative Strength Index (RSI) has decreased up to an index of 66.50 because of the downtrend, hinting at the selling activity in the market.
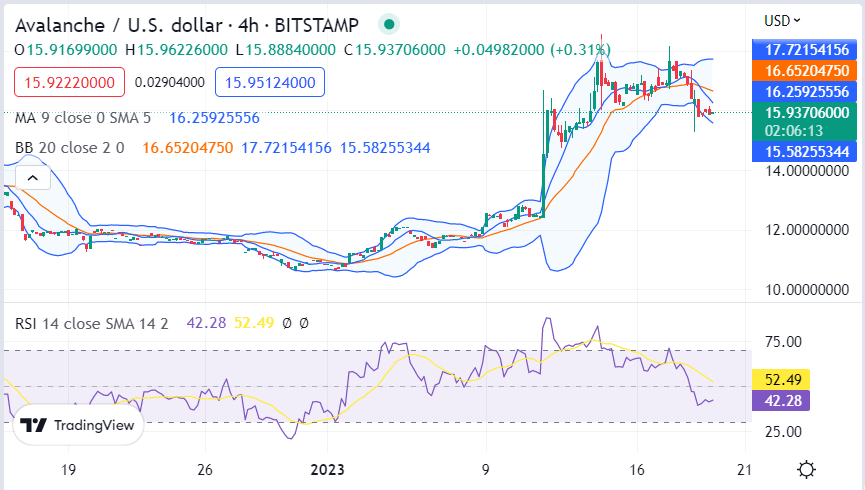
AVAX/USD 4-hour price chart: Support level at $15.75 which is the next target for the coin
The 4-hour price chart for Avalanche price analysis shows a tremendous decline has been observed in price in the last few hours. The price has slumped to the $15.85 level as the bearish wave has been quite strong in the past few hours. However, there was a bullish pressure that was seen the previous day that rallied the coin up to the $17.28 level, but the bears took control again, and consequently, the price touched a new low.

A crossover between SMA 20 and SMA 50 is seen in the 4-hour chart, which is a bearish sign. Simultaneously, the moving average indicator is seen at the $16.25 level, while the RSI has declined to index 52.49. Similarly, The Bollinger bands are also seen to be widening, which suggests that the market is highly volatile.
Avalanche price analysis conclusion
To conclude, the Avalanche price analysis indicates that the current bearish trend seems to be coming to an end today as the price has started to recover again. This can be confirmed by the appearance of the red candlestick on the both 1-day and 4-hour price charts. The bullish pressure will likely be seen in the upcoming days, but at present, the bearish wave is more probable to persist for some time.


