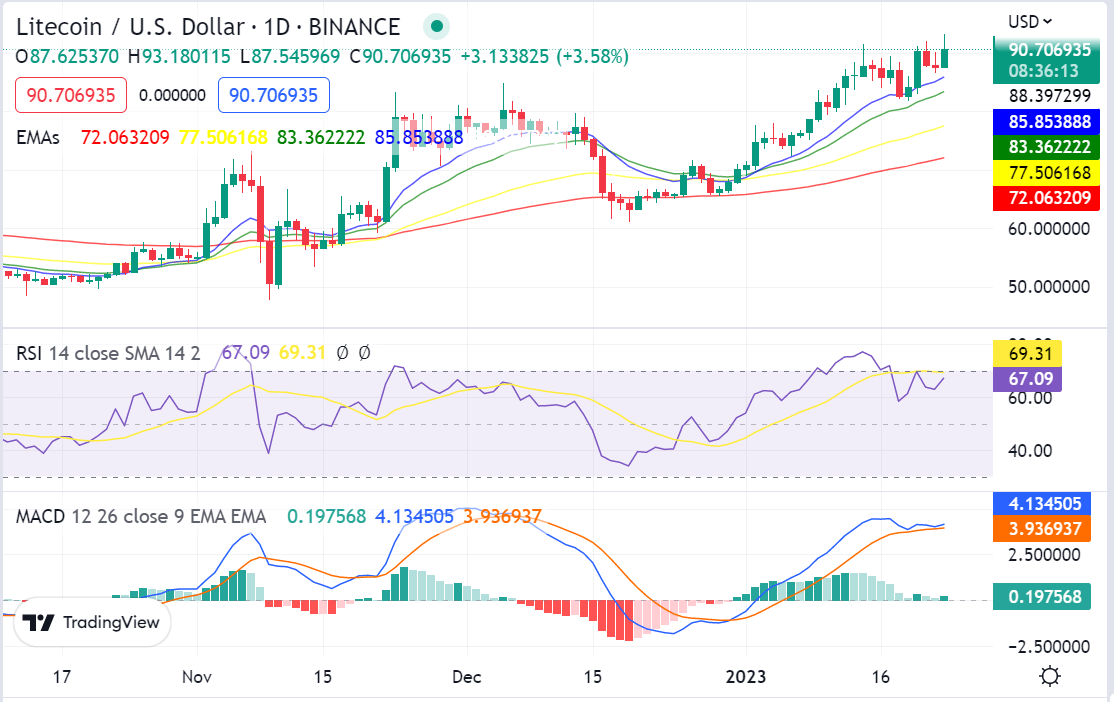
Litecoin price analysis reveals a continuation of bullish momentum for today despite the fact that the broader crypto market is in the retracement phase today. The price of LTC/USD rose from $86.99 to a new high of $90.93 today and is currently consolidating around the level. The bullish momentum may continue in the short term as long as prices remain above the first major support at $86.99, although there is some resistance at $92.53 which could lead to possible rejection.
LTC/USD 1-day price chart: Litecoin successfully breaks above the $92.53 crucial resistance
The 1-day Litecoin price analysis report reveals that bulls have carried out a strong rally today after yesterday’s recovery. The coin is trading hands at $90.93 at the time of writing, gaining 1 percent value over the last 24 hours. On the other hand, the coin is at a gain of 5.35 percent over the past week, as the last week proved to be a roller-coaster ride for LTC/USD. Currently the bullish seems to be prevailing for the coin, as the next major resistance is present at $92.53.

Looking at the technical indicators, EMA is in the bullish region as buyers step up their effort to push prices higher. The price is currently trading above all major EMA levels, indicating that bulls may have full control of the market trend in the near future. The 9-EMA (Exponential Moving Average) and the 21-EMA have crossed paths indicating that buying pressure is present in the market. The Relative Strength Index (RSI) is currently at 69.31 which indicates that there may be an upside move in the short term. The MACD is in the positive territory and is currently facing north which indicates that the bullish momentum may prevail for a while.
Litecoin price analysis 4-hour chart: Ascending triangle pattern forms
The 4-hour Litecoin price analysis shows the price breakout was downward today, but the correction was small, and soon bulls returned to elevate the price levels. After making a comeback, the bulls secured their position for four hours and then started to rally high just 4- hours back, and the price action is being observed to be covering the range upwards for the last hour as well as they have elevated the price level to $90.93 mark.

The Exponential Moving Average of the 4-hour chart is in bullish territory and is facing up, indicating that buying pressure may be present in the market. The Relative Strength Index (RSI) is currently at 57.69 which implies that buyers are still in control of the market trend. The MACD has just crossed paths into positive territory, further confirming that the bulls are planning to push the price higher.
Litecoin price analysis conclusion
In conclusion, Litecoin’s short-term outlook is optimistic, despite some minor resistance. The first major support for LTC/USD is present at the $86.99 level and bulls may continue their momentum in the short term as long as prices hold above this level. The next resistance is seen at $92.53 and the coin may find rejection if it tries to breach this level.


