The market for Litecoin price analysis is in a positive momentum as the digital asset moved above $95.00 during today’s session. The LTC/USD pair is trading at the $95.73 level which is a good sign for the bulls. The downtrend sentiment was seen a few hours ago as the price went down to $93.05 but the bulls managed to take control of the market and propelled the price higher.
Litecoin price analysis one day-chart: LTC/USD is facing resistance at the $97.73 level
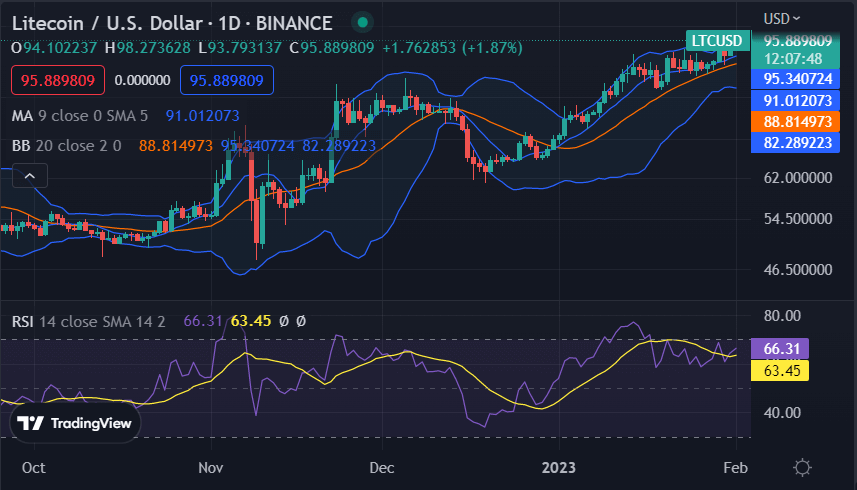
The Litecoin price analysis one-day chart is showing a clearly bullish bias as there are higher highs and higher lows in place. The coin is currently trading in a supply zone between the $97.73 and $93.05 levels. The price has been able to break the resistance at $97.73 but is facing steep selling pressure from the sellers above this level. At the time of writing, the LTC/USD pair is trading at $95.73 and has gained over 1.22% in the last 24 hours.

After rebounding from the lower band of the Bollinger band indicator, the price of the LTC coin is currently trading at the upper band of the indicator. In the daily time period, the price of the LTC currency has broken out above its 14 SMA and 50 MA. It is sitting at these Moving averages at the moment. The moving averages (MA) 50, 100, and 200 are in a positive alignment which is also a good sign that suggests a further upside move in the near term. The Relative Strength Index (RSI) is currently trading at 63.45 and it has its sight set on a break above 70 which could propel the prices toward new highs.
Litecoin price analysis 4-hour chart: Bullish aims for $97.73 level
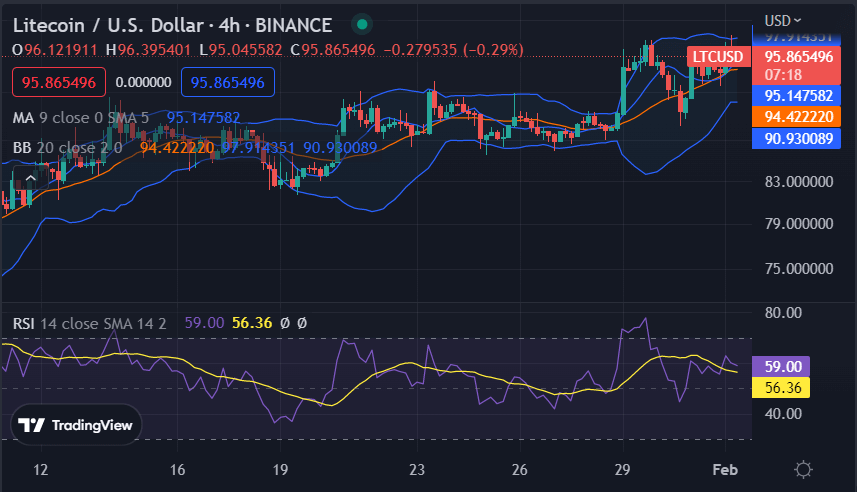
The 4-hour Litecoin price analysis on the LTC/USD pair shows that the coin is trading in a bullish bias and it has broken out of its short-term symmetrical triangle. The buying pressure is coming in from the $93.05 support level and pushing the coin higher toward the $97.73 resistance level. The moving average is currently at $95.14, just below the current price level.

The technical indicators on the chart are also signaling a bullish bias. The Bollinger bands are widening which suggests increasing volatility. The upper Bollinger band is seen at the $97.91 level which could be a significant hurdle for the bulls to break in order to continue pushing the price higher, while the lower Bollinger band is seen at the $90.93 level which is likely to provide support in case of a sell-off. The RSI is currently at 56.36 and it is pointing to the north which shows that the bulls have the upper hand in the market.
Litecoin price analysis conclusion
From the above, Litecoin price analysis shows that the digital asset is currently trading in a bullish bias and has broken out of its short-term symmetrical triangle. The bulls are looking to break the $97.73 resistance level, while the $93.05 support level will likely provide some much-needed support in case of a sell-off.


