The Chainlink price analysis shows a price decline today. LINK/USD price has come down to $7.17 at the time of writing. After rallying towards $7.47, selling pressure has built up in the market, and the coin has started the correction. The LINK/USD pair is on a slight downtrend after the bullish pressure from buyers was exhausted.
The LINK/USD pair is facing resistance at the $7.47 level and could not break above it during the morning session. This shows that bearish momentum has taken over in the market and a downtrend is forming. The support for the LINK/USD pair is found at the $7.04 level. If the price breaks below this level, there is a chance that it could go down further. The LINK /USD has decreased by 0.91% in the last 24 hours.
LINK/USD 1-day price chart: Chainlink goes into the correction phase
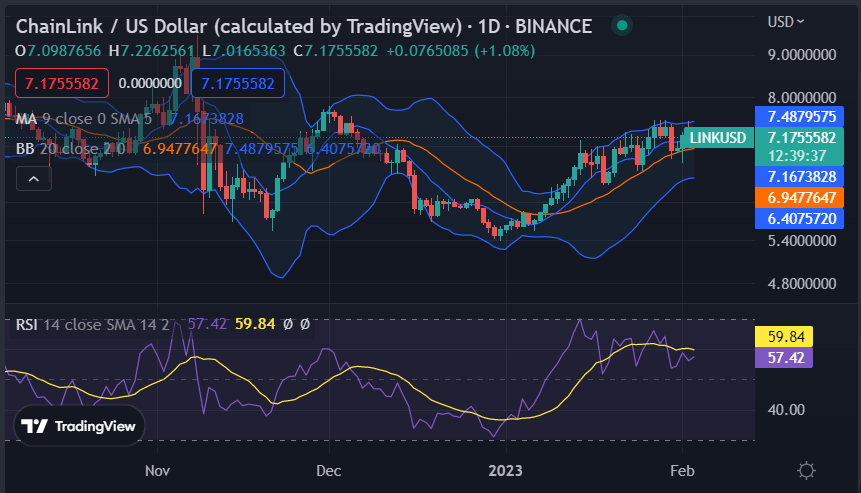
The 1-day Chainlink price analysis reveals a drop in price level, as the value of cryptocurrency dropped slightly today. After spiking high yesterday, LINK seems to be retracing as the price reached near the resistance of $7.47. LINK/USD is still on the downside, as it has yet to break above the resistance level. The price of LINK is likely to remain volatile in the near term, with a bearish bias prevailing in the market.

The Bollinger band indicator is showing convergence and a bearish signal, With upper Bollinger bands at $7.48 and lower Bollinger bands at $6.40, LINK/USD is stuck in a range-bound movement. The Stochastic RSI is also indicating that the market is overbought, which could be a sign of further price drops to come. The 20-day and 50-day moving averages are in line with the downtrend as both have been trending lower. This suggests that LINK/USD could remain bearish in the coming days.
Chainlink price analysis 4-hour: LINK/USD faces bearish at $7.17
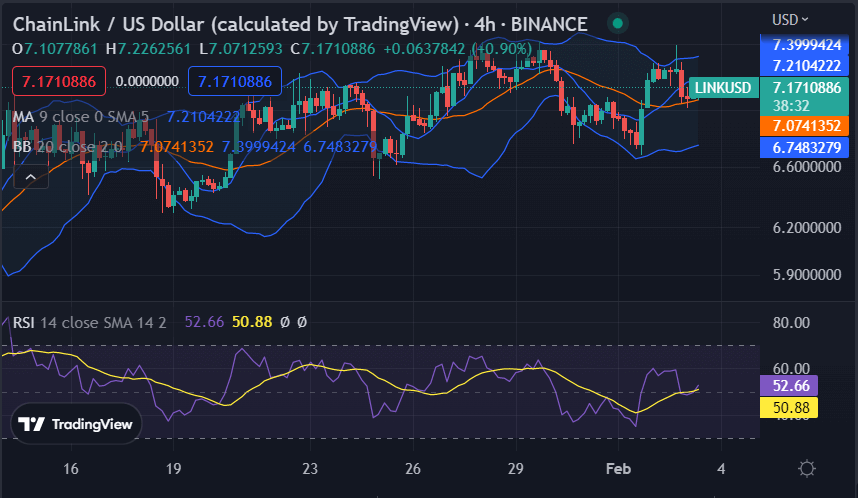
The 4-hour price chart for Chainlink price analysis shows a red candlestick getting larger with the time on the chart, as the selling pressure has formed for LINK. After the bullish activity of yesterday and even an upwards price breakout today, bears have successfully turned the tables and are decreasing the price down. As the LINK/USD pair price declines, the next support that bulls can hold on to is at $7.04.

The volatility is increasing during the current hours as Bollinger bands are diverging. The Bollinger band ends are expanding with the top band at the $7.39 mark and the lower band at the $6.74 mark. The moving average is at the $7.21 mark. The RSI has dropped to the oversold region, suggesting that LINK could make a slight bounce in the near future.
Chainlink price analysis conclusion
All in all, it appears that Chainlink is going through a bearish phase as of now and further downward price movement cannot be ruled out. With buyers unable to break above the resistance of $7.47, the LINK/USD pair is in the correction phase and could go down further if the support of $7.04 is breached.


