The Ripple price analysis shows bullish signs today. XRP/USD price is still moving up continuously for the past few days and is currently trading at $0.4126, which is a sign of significant progress since yesterday’s low of $0.4013. The bulls have been able to push the price up above the key $0.4126 resistance level, with a strong close above this level likely to confirm that we are in an uptrend now. On the downside, support for XRP/USD is present at $0.4074 and any break below this support level could see the price drop toward $0.4007 or lower.
The market for XRP/USD is up more than 1.58% in the past 24 hours, and the bulls are currently attempting to break out of a descending triangle pattern that has formed on the daily chart. The market cap for XRP continues to rise and is currently at around $21 billion, while trading volume is up to $548 million.
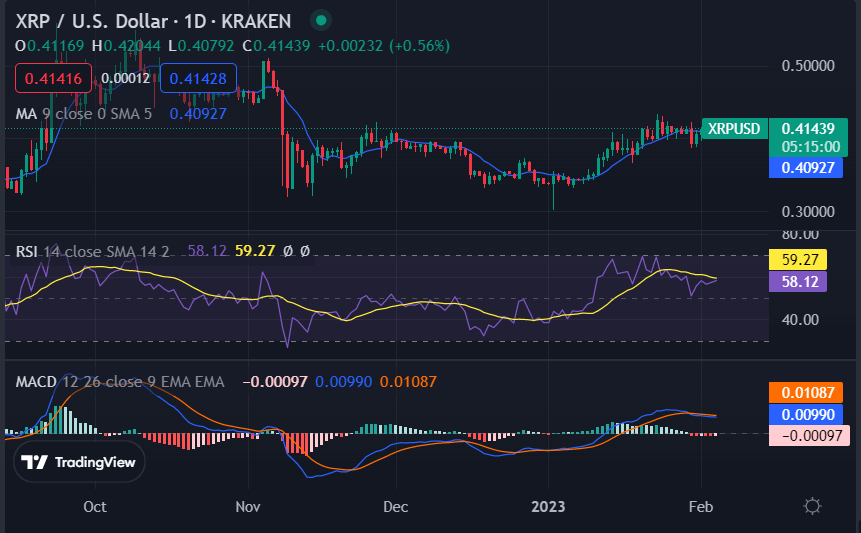
XRP/USD 1-day price chart: Cryptocurrency trades in greens as bulls continue ruling
The one-day Ripple price chart shows that the bulls have been the main drivers of price movement. The bulls and bearish are in a tug of war, but the bulls have been able to push the price above the key $0.4126 resistance level. The bearish had pushed the price down to $0.4074 at one point, but the bulls have been able to reclaim the level.

The moving average convergence divergence (MACD) is positive and rising, which indicates that the uptrend is still intact. The relative strength index (RSI) is at 59.27, which is in the neutral zone, showing that there may not be any extended upside momentum. The moving average(MA) is currently at $0.4092, just below the current price level, which implies that the bulls may see some resistance at this level.
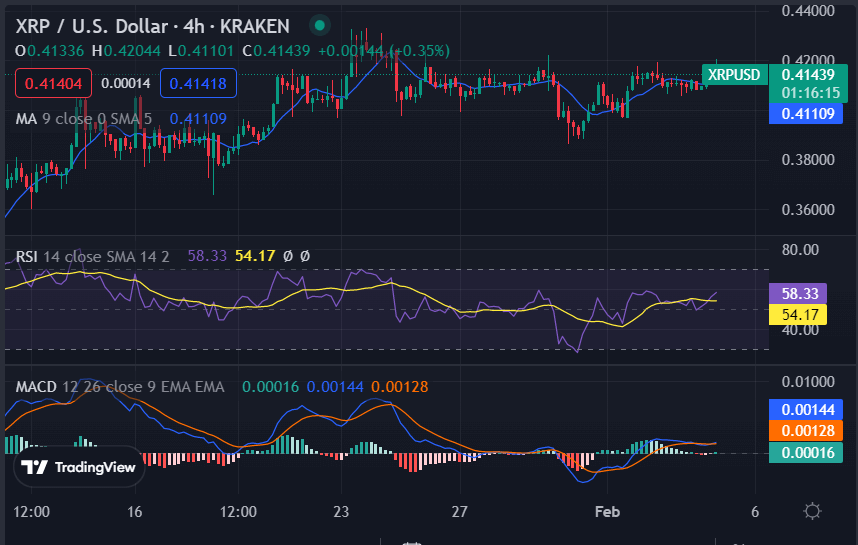
Ripple price analysis 4-hour chart: XRP gains momentum at $0.4126
The 4-hour price chart for Ripple price analysis shows that the bulls are in full control of the market. The market has formed a cup and handle pattern, which is a bullish continuation pattern. The price has been rising steadily since the formation of the pattern.

The MACD is positive and rising, with the histogram in the positive zone, showing that the buyers are in control of the market. The RSI is at 54.17, which shows that there may not be any extended upside momentum. The moving average (MA) on the hourly chart is currently at $0.4110, with 50-MA at $0.4140 and 100-MA at $0.4141, which implies that the bulls may see some resistance around these levels.
Ripple price analysis conclusion
Overall, the Ripple price analysis is bullish. The bulls have been able to push the price up above the key $0.4126 resistance level, and any close above this level could confirm that we are in an uptrend now. The technical indicators also suggest that the bulls may have an edge over the bears in the short term. However, it is important to keep in mind that any unexpected news could send XRP/USD prices lower.


