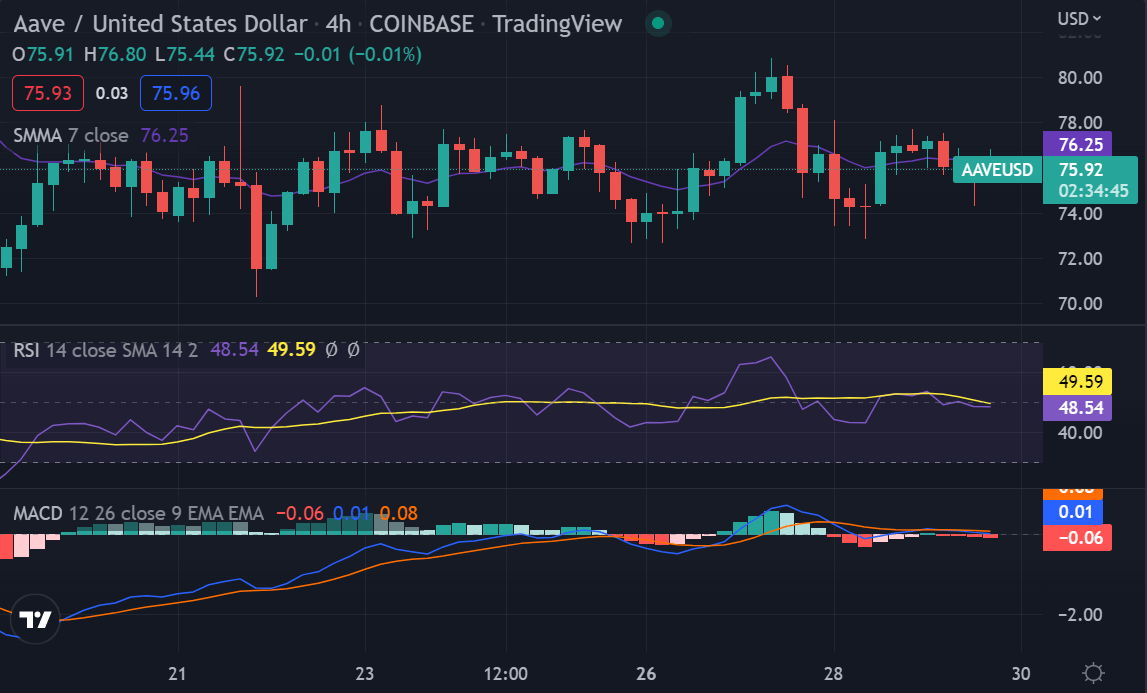
Aave price analysis for 29th September 2022 reveals that AAVE opened the daily trading session at an intraday high of $76.05.There was some buying action in the market during the wee hours of the day, and AAVE surged to highs of $77.5 before bears came in to push the price to the current trading level of $76.36.Aave bulls have been very active in the day as they have been able to breach two critical resistance levels. The bulls pushed the prices above $75, and later on the 4-hour chart, a strong buying action was witnessed, with AAVE prices breaking above another key resistance level of $76.
Aave currently ranks at position 47 with a market dominance of 0.11 percent. The trading volume currently totals $88,788,048.67, while the market cap is $1.06 billion. The AAVE/USD pair’s main support level is $74.69. If the price breaks below this level, it could fall to $74.00 in the short term. Resistance for AAVE/USD is present at $78.13. If the price break above this level, it could start an uptrend and rise to $80.50 in the near term.
Aave price analysis on a daily chart: Bullish crossover on the cards
Aave price analysis on the daily chart shows mixed signals as bulls and bears battle for price control. The bulls, however, have gained steam in the last few hours as they have been able to push the prices from a low of $74.56 to the $76 level. Aave price analysis reveals that the market has seen some consolidation in the past hours as prices fluctuate between the $72 and $76 levels. The current price surge has taken the prices to the upper limit of the consolidation range, and a further move-up may take place in the near term as the price is currently trading at the $76.33 mark.

The 1-day technical indicator for the Aave market shows mixed signs as the price is currently at equilibrium. The MACD line is currently on the verge of crossing the red signal line from above, which indicates a bullish crossover is imminent. The RSI indicator currently trades at 43.34 and shows no signs of overbought or oversold conditions. The 50-day simple moving average provides support for the market at the $73.33 level, while the 200-day simple moving average provides resistance for the market at the $77.51 level.
AAVE/USD 4-hour chart analysis: AAVE Price at equilibrium as bears and bulls battle for price control
Aave price analysis on the 4-hour chart shows bulls had gained steam and managed to breach key resistance levels before bears came in to cut the bullish continuation. The bulls are defending the immediate support of $76.Aave price analysis on the 4-hour chart shows AAVE/USD is seen trading inside an ascending parallel channel as prices corrected lower after hitting the upper limit of the channel. The current move can be considered a retracement as the prices are still trading inside the bullish channel.

The RSI curve is currently residing at 49.71 and is not providing any clear indication as to the direction of the market. The MACD indicator is also trading close to the zero line, which shows that there is no clear trend in the market at the moment. The 50-day SMA and the 200-day SMA are moving close to each other, which is a sign of further consolidation in the market.
Aave price analysis conclusion
Aave price analysis for today concludes that the bears have been in control before the bulls came in to recover the market. However, the bull run was cut short before the market shifted to bullish sentiment. Although the market is currently in a bearish trend, the bulls can take back control and push prices higher. However, this is unlikely to happen in the near term as the market indicators all suggest further downside potential.
Disclaimer. The information provided is not trading advice. Cryptopolitan.com holds no liability for any investments made based on the information provided on this page. We strongly recommend independent research and/or consultation with a qualified professional before making any investment decisions.


