Aave price analysis shows a bearish trend as the token is currently unable to break above the $85.13 resistance. This follows a recent bearish run that saw AAVE drop from highs of $88.00 levels. AAVE/USD is facing rejection at $85.13, and a break above this level could see the token target the $88.00 level once again.

However, there is support for AAVE at $80.89, which may prevent further downward movement in price. The digital asset has decreased by 2.10% in the past 24 hours, and it remains to be seen if AAVE can rebound from current levels. The market cap for the coin has decelerated to $1.17 billion, with a 24-hour trading volume of $131 million.
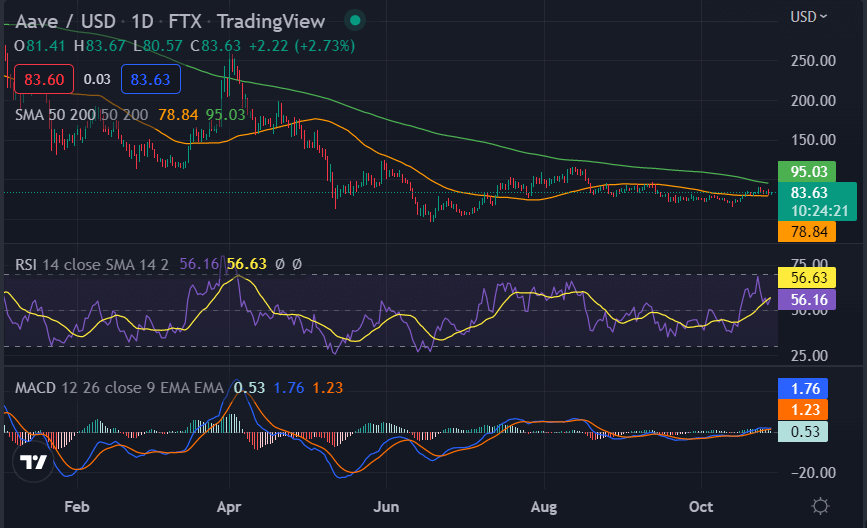
AAVE/USD 1-day price chart: price levels decrease to $81.93
The 1-day price chart for Aave price analysis shows bears are defining the price movement today. The AAVE/USD is correcting after the strong bullish price movement of yesterday. AAVE/USD pair is trading hands at $81.93 at the time of writing. The past two days overall proved profitable for the crypto pair as it gained around 2.36 percent. And today, the selling pressure has returned, and the trend is bearish as bears are bringing the price down.

The SMA 50 and 200 are above the candlesticks, suggesting a bearish trend in the market. The MACD also shows bears have control over the market as the MACD line is below the signal line. The relative strength index (RSI) is also confirming the downtrend for today as it is on a downward curve at index 56.63, indicating the selling activity in the market.
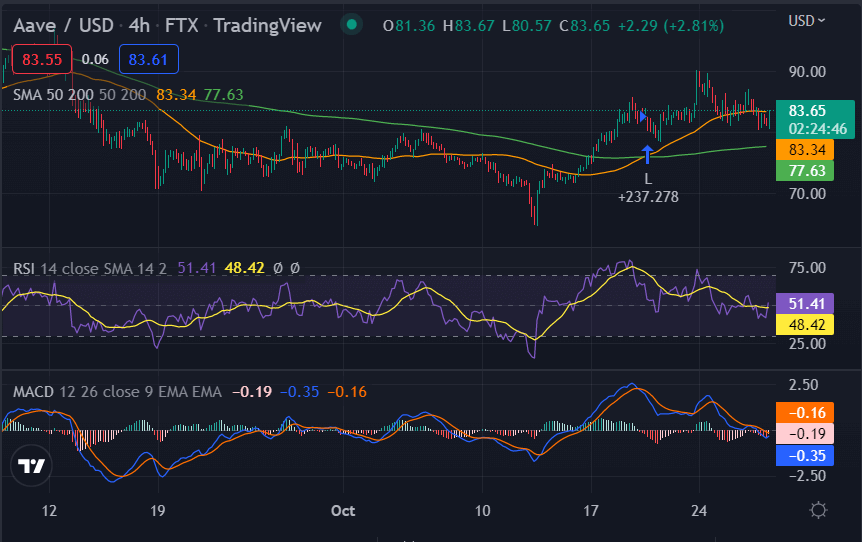
AAVE/USD 4-hour price chart: Aave continues downside after facing rejection at $85.13
The 4-hour price chart for Aave price analysis shows that bears are striving for the lead and have caused major damage at the start of the trading session as they dragged the price down to the $81.93 level. On the other hand, the bulls have dodged the bearish pressure as support has appeared, and the price has bounced back to the $81.00 level currently.

The histogram of Moving average convergence divergence (MACD) is negative, supporting the bearish trend in the market. The MACD line has crossed below the signal line, indicating a potential price drop in AAVE/USD pair. The relative strength index (RSI) is also leaning towards the selling side as it is at 48.42, showing indecision in the market currently. The 50 SMA is currently at $80.59 and is providing support to the AAVE/USD pair, while the 200 SMA at $85.13 indicates strong resistance in the market.
Aave price analysis conclusion
Overall, Aave’s price analysis shows that the token is facing bearish pressure and may continue to see downward movement in price. However, support levels may prevent a significant decline in price. Traders should watch for a potential break above the $85.13 resistance or a break below the $80.89 support level for further direction in AAVE’s price movement.


