
The most recent Aave price analysis confirms an increasing trend for cryptocurrency as the coin value has increased today. Earlier, as a correction appeared to dominate the market for a few hours yesterday, the market value of cryptocurrency fell, but it soon recovered. The price function moved in a bullish direction from the beginning of the current trading session, and after a slight recovery, the price is currently trading at $72.48. There is potential for modest bullish expansion, yet negative resistance is still in place.
AAVE/USD 1-day price chart: Successful resurgence for the bulls observed
The one-day Aave price analysis confirms a bullish trend for today as the coin value has undergone some degree of improvement. Although the coin’s value had previously declined, the effort from buyers to keep prices up has been commendable and persistent, as the price trend line has been moving upward for three days in a row. The circumstances are in favor of the bulls, as the price covered an upward movement up to $72.48, though the crypto pair reports an increase of only one percent over the last 24 hours; overall, the coin has gained more than 3.45 percent value over the past week.
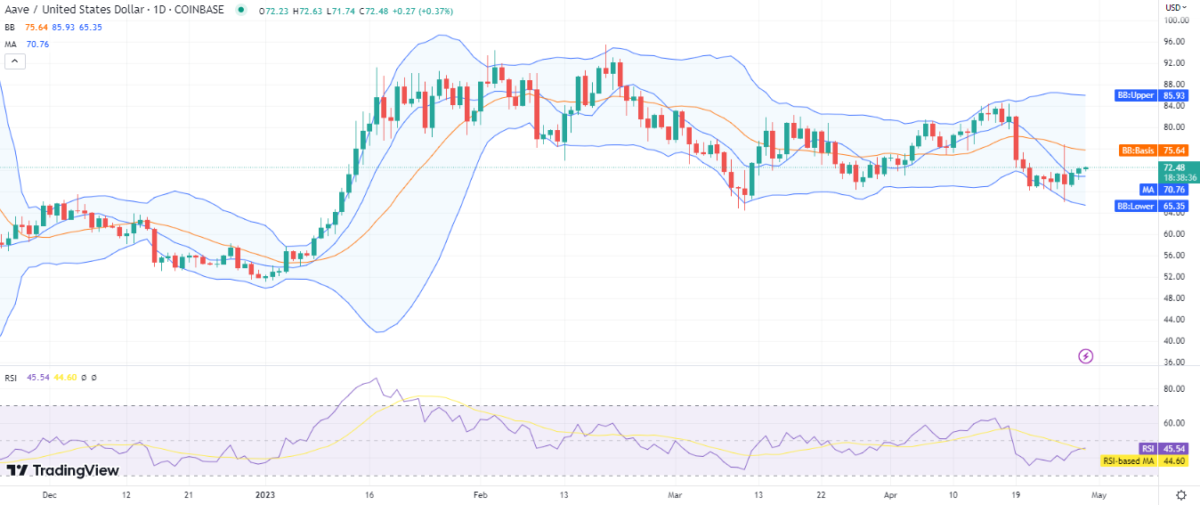
The moving average (MA) is still trading at $70.76 below the SMA 50 curve and the current price level. The volatility in the one-day price chart is comparatively high, with the upper Bollinger band at $85.93 representing the strongest resistance for the crypto pair, and the lower Bollinger band at $65.35 representing the strongest support for AAVE/USD. The Relative Strength Index (RSI) score has improved today, reaching index 45, and will continue to do so if the market’s purchasing activity picks up.
Aave price analysis: Recent developments and further technical indications
The 4-hour Aave price analysis favors the bullish side as a slow rise in AAVE/USD value has been detected in the past few hours. The bulls have worked tirelessly to regain control of the market, and so far, their advancement has been fascinating. Due to the bullish trend, the price increased to $72.37 in the most recent four hours. For the past 20 hours, the price action has generally been moving upward.

At the same time, the moving average is trading at $71.64, just below the price level. As price oscillations were comparatively low, the Bollinger bands indicator covered less area. As it shows the following values in the hourly price chart now; the upper value is $73.45, whereas the lower value is $68.60, the price is moving towards the upper limit of the Bollinger bands. Due to the upswing, the RSI score has also gradually increased to index 56.
Aave price analysis conclusion
This is confirmed from the above one-day and four-hour Aave price analysis, the market is currently being ruled by the bulls. The assumption of a bullish trend has been supported by the rise in price. And today’s market was dominated by a bullish wave, resulting in an increase in the price of AAVE/USD to $72.37. If buying activity picks up steam in the ensuing hours, the bullish current might become stronger. On the other hand, an hourly correction is also feasible because the RSI’s upward curve is not particularly steep and the price is getting close to the hourly chart’s upper bound of the volatility indicator.


