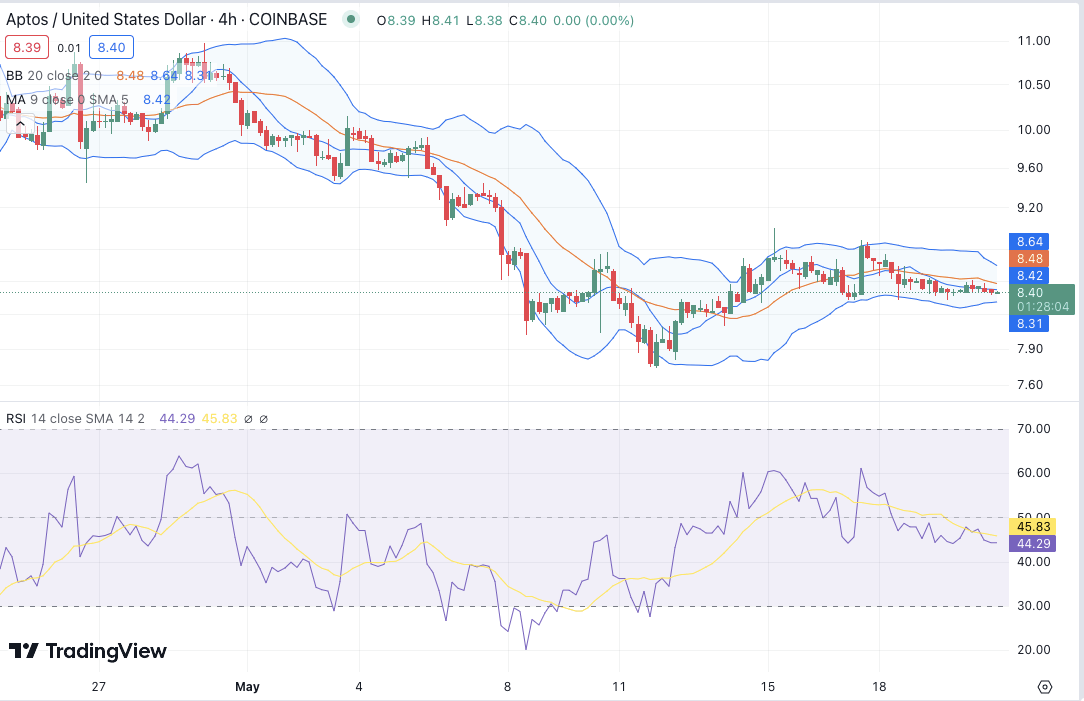
The Aptos price analysis suggests the APT/USD price function has been suppressed by the bearish pressure, as a drop in price level has been reported for today. The bulls are trying to hold on to $8.39 after following the downward movement since morning. Currently, it is present at an $8.42 value as a slight bullish recovery has been detected in the last four hours. Although the bears tried to restrict the upward trend, the bulls are trying to proceed with their mission once again but are unable to uplift the price considerably as the bearish pressure still weighs on the price function, and the power of balance lies towards the bears.
APT/USD 1-day price chart: Bearish momentum drags price to the $8.52 level
The one-day Aptos price analysis is showing signs of bearish activity as the red candlestick has returned to the price chart. The past two days have proved crucial for the cryptocurrency, as a downward trend has been following. There has been a recurring fall occurring in the coin value, and today its value has been lowered to $8.52, losing 0.50 percent value during the last 24 hours.

The current price value is below the moving average (MA) value which is settled at $8.49. The Bollinger Bands Indicator in the 1-day price chart points out the following values; the upper value at $9.99 and the lower value at $7.61, which suggests that the coin is trading within the normal range in this market. The Relative Strength Index (RSI) is settled at 36.70 which indicates that the coin is still under bearish pressure as it has failed to move above the 50 mark regularly.
Aptos price analysis: Recent developments and further technical indications
The price has been traveling low according to the four hours Aptos price analysis. The recent downturn in price movement has resulted in its decline as it has been below $8.50. Chances of recovery seem minimized as the bullish efforts have not been fruitful so far. The price has been trading below the moving average value as well, which has been standing at the $8.42 position.

The Bollinger bands indicator has been widening and contracting which suggests that the volatility in the market is increasing. The upper band is at $8.64 whereas the lower value has been seen at $8,31, indicating an increased range of price movement on either side. The relative strength index has also declined to 44.29 suggesting the bearish pressure that is still at work for APT/USD.
Aptos price analysis conclusion
To sum up, Aptos price analysis indicates that the overall technical analysis of Aptos shows that there is an absence of strong demand for the currency and the market sentiment in its favor is weak. The downward trend in price suggests a strong control by bears, which could result in a further decline. However Bulls are attempting to regain control of the market, and if they manage to take over, there is a potential for a bounceback in price. Aptos needs a strong bullish push in order for it to sustain its current levels.


