Aptos price analysis reveals that the market is following an uptrend after a recent bullish stream. The APT/USD pair has experienced an increase of over 2.43 percent in the last 24 hours and is currently trading at $8.41 per token. The support for the APT/USD pair is at $8.25, and the token is currently trading below the resistance level. If the bulls manage to break and sustain above the current resistance levels of $8.63, the APT/USD pair could see further upward movement toward its next major resistance level of $8.75. The bulls are currently targeting a move above the $8.53 level to confirm a strong bullish trend in the near-term outlook. The coin has seen strong support from investors as the market sentiment remains bullish with new traders entering the space and buying into the coin.
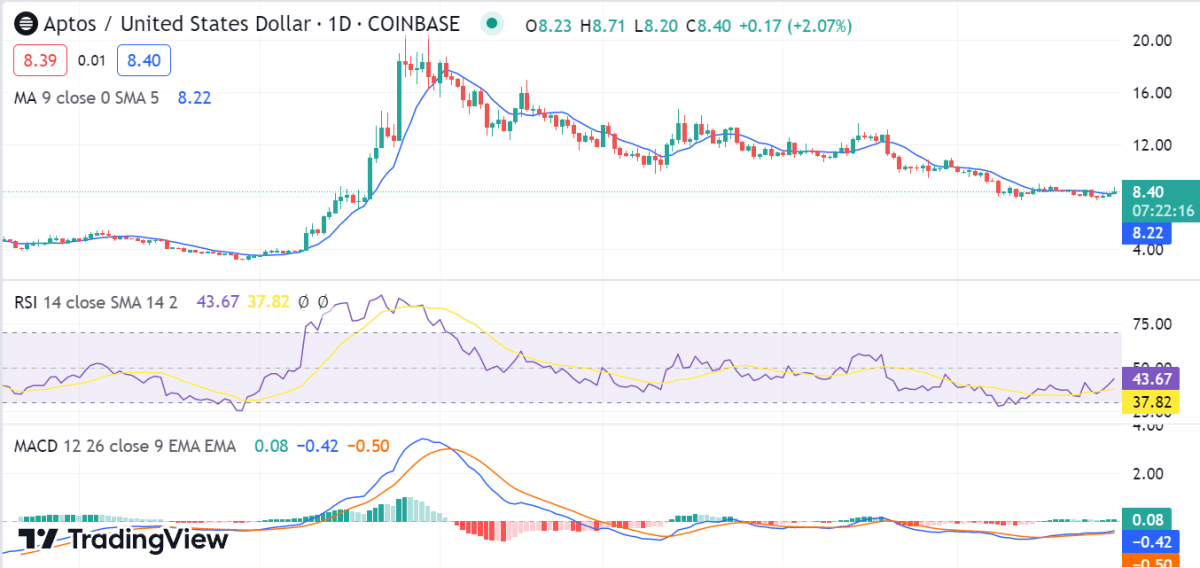
Aptos price analysis 1-day chart: Bullish momentum pushes the price up to $8.41
The 24-hour Aptos price analysis shows that the market has been in an uptrend since opening trading today. The bull and bears have been seen battling for control over the market, but the bulls regained control and pushed the prices up to $8.41, which is where it is currently trading. In terms of volume, Aptos has seen a steady increase in the last 24 hours and is currently trading at $93 million in total trading volume. The coin has also seen a surge in its daily active users as more investors are looking to enter the market. Aptos is currently ranked 33rd in terms of market capitalization, with a total cap of $1.66 billion.

The price is still trading above its moving average (MA) value, which is at the $8.22 mark, and this indicates that the market has room for further growth in the near term. The relative strength index (RSI) indicator is currently at the 43 mark, which indicates that the market has increased slightly. The moving average convergence and divergence (MACD) indicator is also positive, and this suggests that the market could remain bullish in the short term.
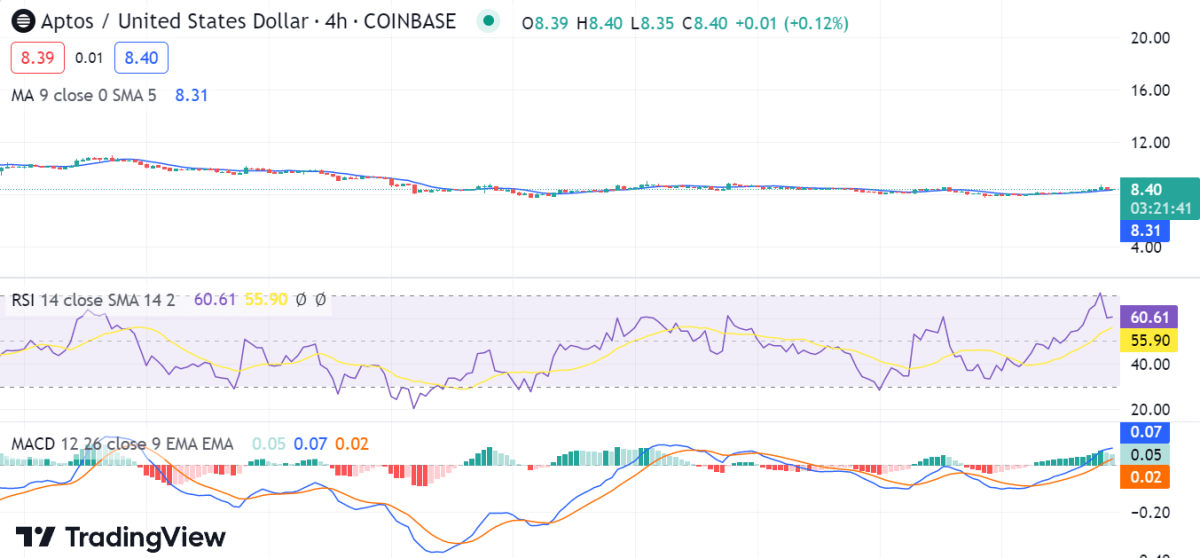
APT/USD 4-hour price chart: Recent updates
The 4-hour Aptos price analysis demonstrates that a modest bullish trend line that has been established by the market and is currently supporting it has been produced. The costs haven’t changed significantly in the recent four hours. The bulls have maintained prices above $8.41 and are likely to continue doing so in the near future. The volatility for the APT/USD pair is also increasing, which is an encouraging sign for buyers regarding the upcoming price trends.

The moving average convergence divergence (MACD) is above the red signal line, which could be a sign of bullish momentum in the near term. A bullish crossover and a move above the red signal line could indicate further upside for the token. The 50-moving average and 200-moving averages are both still rising, which indicates that the long-term trend is still bullish. The RSI is currently at 60, which indicates that the market is in overbought territory.
Aptos price analysis conclusion
Overall, the market sentiment for Aptos is positive, and it seems that the coin could see further growth in the near future. The bullish trend line is currently supporting prices, and if the bulls can maintain control over the market, then it is likely that APT could experience more gains in the near term.


