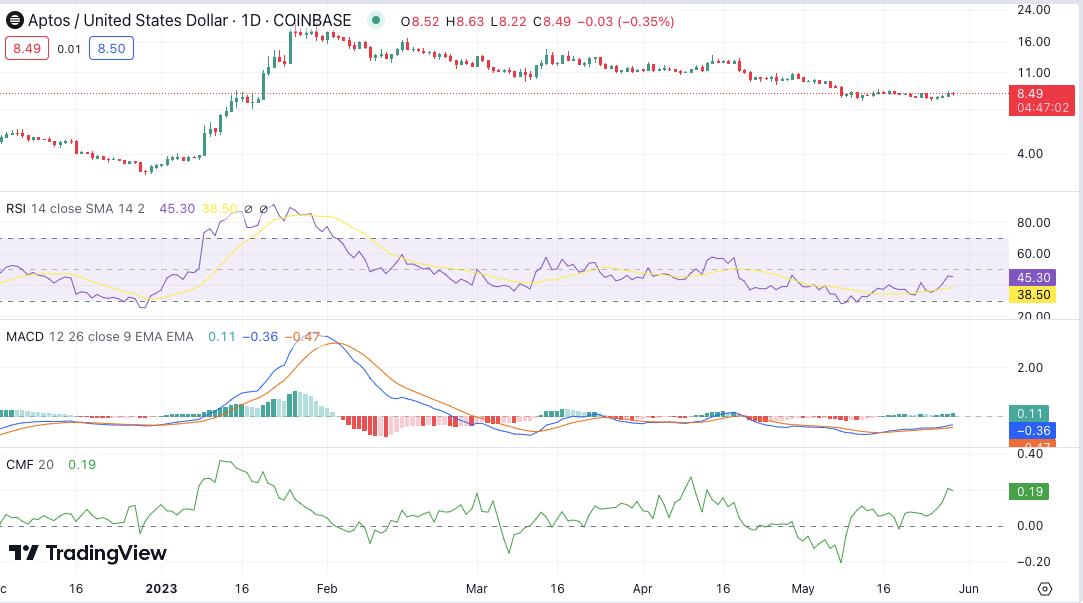
The latest Aptos price analysis shows signs of a strong downtrend, as the price curve shows a downward movement for the day. The selling pressure is mounting, and the coin has dropped to a low of $8.45. The resistance present at the level of $8.62 could not hold the bearish momentum, and APT eventually broke through this barrier. The bullish momentum was in the market in the past few hours, but the selling pressure is greater and has managed to push down the price.
APT/USD 1-day price chart: Cryptocurrency faces further downside as price falls below $8.62
The bearish trend is taking over the market as Aptos price analysis value underwent a marked decline in the last few hours. The support present around the $8.24 level has not been able to hold up the price and has further dropped by 2%. It is expected that a further downside correction may occur in the coming hours as APT continues its decline. The current market sentiment is bearish, and it is likely to remain so until the coin shows signs of a bounce back.
The market capitalisation for APT is present at $1.681 billion and is down by 0.92% for the day. However, the 24-hour trade volume is still strong at $107 million, showing that the coin is still being actively traded. The market currently holds a mix of both buyers and sellers, but the selling pressure has the upper hand.

The technical indicators on the daily chart are painting a bearish picture for APT 20 EMA is below the 50 EMA, indicating that the coin is in a downtrend. The Chaikin Money flow has also sunk into the negative side, indicating that capital outflow is more than capital inflow. The MACD line has crossed above the signal line, forming a bearish crossover, confirming the bearish trend in the market. The Relative Strength Index is also at a low of 45.30, showing that the coin is in the neutral zone.
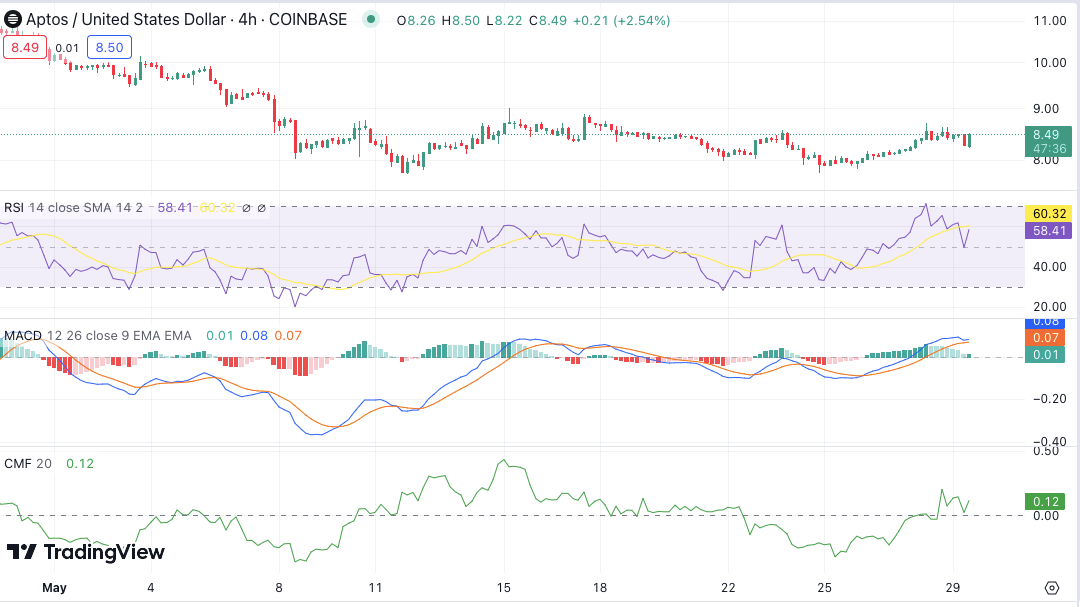
Aptos price analysis: APT levels collapse at $8.45 after bearish drift
The four-hour Aptos price analysis indicates a declining trend for the cryptocurrency, as the bears have been maintaining their lead. In the past four hours, the APT/USD value drastically declined to $8.45 because of ongoing selling pressure. The bearish trend has been consistent for the past few hours and will most expectedly remain strong in the upcoming hours.

The moving average convergence divergence levels are indicating a bearish trend in the market, as the MACD line has recently crossed above the signal line, forming a bearish crossover. The 100-EMA is below the 200-EMA, indicating that the bearish trend is still in place. The Relative Strength Index is also at a low of 58.41, showing that the coin is in the neutral zone. The Chaikin Money Flow is also on the negative side at -0.12, indicating that capital outflows are greater than capital inflows in the market.
Aptos price analysis conclusion
In conclusion, Aptos price analysis shows a strong bearish trend with no signs of reversal in sight. The current resistance level for APT/USD is present at $8.62, and any upside movement will be met with strong resistance. The support level is present at $8.24, and any further downside movement will most likely bring the coin to this level in the near future. The technical levels are also confirming this downtrend, and it is likely to remain so in the coming hours.


