Coinspeaker
ARK Bitcoin ETF Outflows Surpass Grayscale’s GBTC
According to Farside Investors, this marked a significant moment, as ARKB’s outflow exceeded GBTC’s by roughly 1,300 BTC. Notable, this was ARKB’s second consecutive day of outflows, losing $300,000 in assets the day prior, its first-ever outflow.
Comparing ARKB and GBTC’s Market

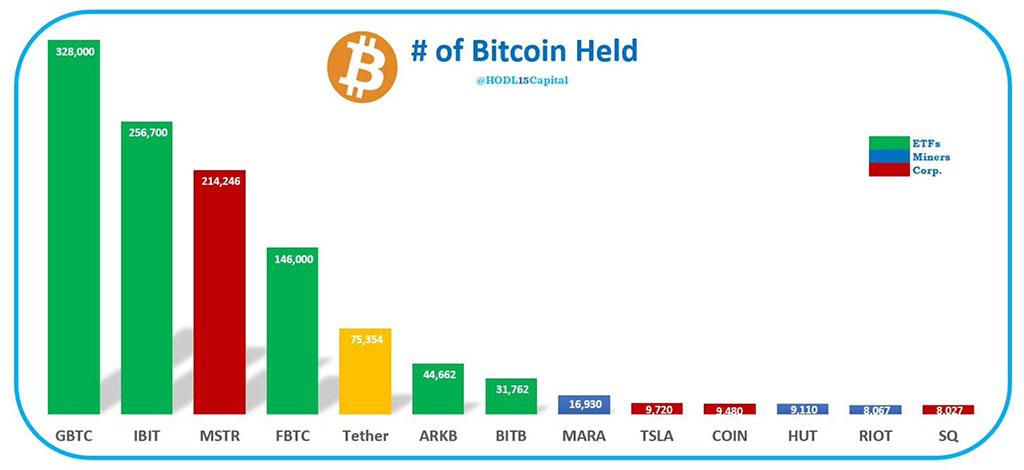
Photo: HODL15Capital / X
Despite these outflows, ARKB remains a major player among the recently launched spot ETFs, with $2.2 billion in assets under management and holding 44,662 bitcoins. Grayscale, however, continues to lead in total Bitcoin holdings, with approximately 328,000 BTC. The price of Bitcoin has declined about 9% from the previous week amidst these increasing ETF outflows. However, Bitcoin ETFs still managed net inflows of $38.8 million on April 2, primarily driven by BlackRock’s IBIT and Fidelity’s FBTC.
Market Response and Future Outlook
The ETF outflow incident has stirred the market. Grayscale has faced a staggering $15.1 billion loss over the past three months, a significant contrast to the $150.5 million inflow BlackRock’s fund witnessed. The broader impact of these shifts is evident in the overall market performance, with Bitcoin’s price briefly dipping below $65,000 amid the ETF outflows.
Lolz. Its actually a $302.6 mln outflow for GBTC today — honestly higher than i expected. Thought this was have slowed down by now. https://t.co/uFXDrjrWg0
— James Seyffart (@JSeyff) April 1, 2024
This event has sparked discussions regarding the stability and future of Bitcoin ETFs. Analysts are closely watching the market for signs of stabilization or further shifts in investor sentiment. James Seyffart, an ETF analyst from Bloomberg, commented on yesterday’s outflow of GBTC. He mentioned that the outflow of $302.60 million is quite high compared to his anticipation. He further stated that the outflows, particularly for GBTC, should have been slowed down by now.
The first ever 2x and -2x spot bitcoin ETFs hit the market today from ProShares. $BITU and $SBIT (tickers could have been better). $BITX is 2x but it tracks futures and $BITI is -1x but is also futures. Fee 95bps on both. Haven't traded too much so far, under $1m. pic.twitter.com/jtH1A4DbAc
— Eric Balchunas (@EricBalchunas) April 2, 2024
Additionally, the introduction of leveraged spot Bitcoin ETFs adds another layer of complexity, promising heightened volatility and potentially reshaping the ETF landscape further. Another Bloomberg ETF analyst, Eric Balchunas, mentioned that the launch of the first-ever 2x and -2x leveraged spot Bitcoin ETFs will be among the top 5 most volatile ETFs in the US out of the total 3,400.
Bitcoin Chart Analysis

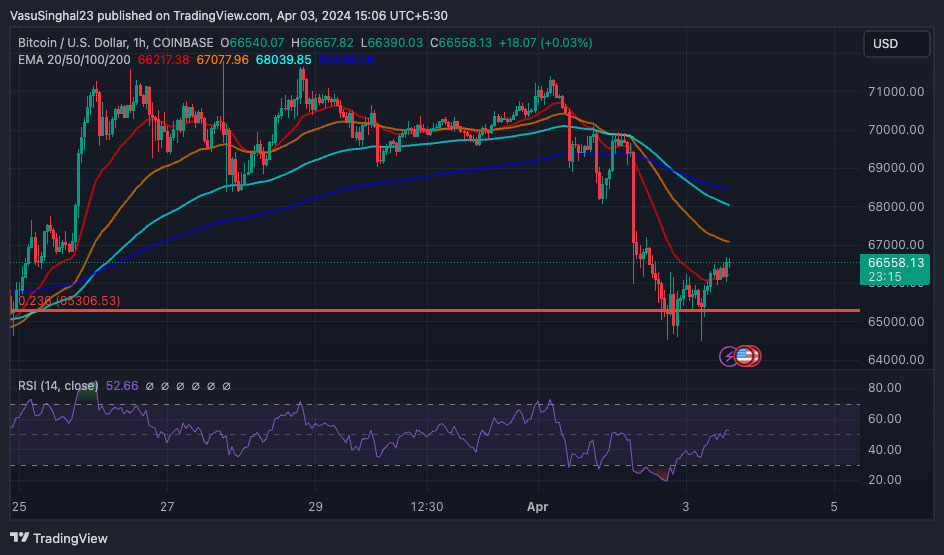
Photo: TradingView
The recent price action of Bitcoin (BTC) indicates a bearish trend, as the price has crossed below multiple key EMAs – the 20,50, 100, and 200 – suggesting a strong downtrend. The price appears to have found some resistance around the $66,400 mark, evidenced by a minor rebound. However, the presence of the EMAs above the price action could act as resistance levels for any upward movement.
The Relative Strength Index (RSI) is a key indicator to consider, currently standing at 51.65. This value suggests that the market is neither overbought nor oversold, providing little directional bias. The recent price movement indicates a period of consolidation following a sharp decline. Traders might look for potential sell signals if the price fails to break above the closest EMA or potential buy signals if there’s a reversal pattern with support from volume and the RSI moves positively out of neutral territory. It’s crucial to watch for a clear break from this consolidation pattern to determine the next move.


