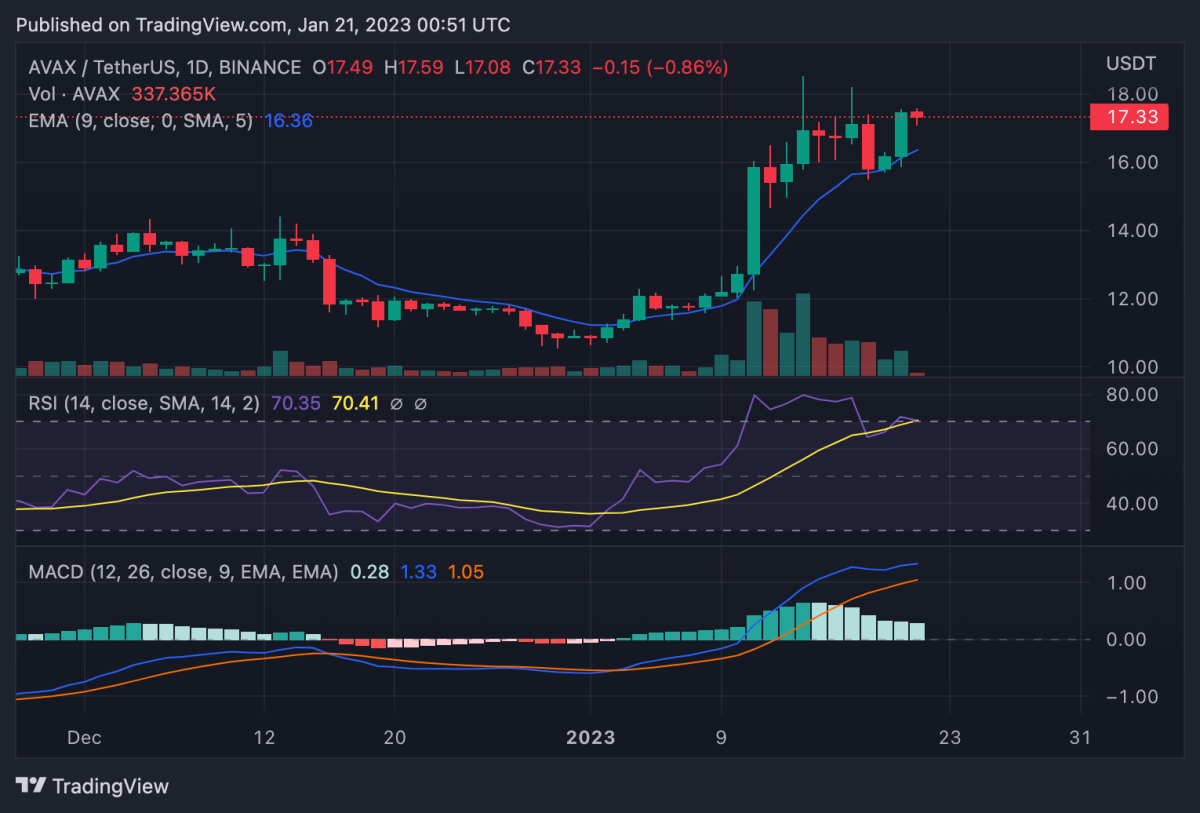
Avalanche price analysis shows a positive sight for bulls, as price jumped up to $17.60 over the past 24 hours, incurring an 8 percent rise. Since January 11, AVAX has shown a highly volatile price movement with a mixed set of red and green candlesticks on the daily chart. Over the past 24 hours, Avalanche price rose up to $17.60 and has since settled at $17.45 at the time of writing. The high volatility makes it unpredictable to suggest where price might go next, however, the immediate resistance point sits at $17.80, with support at $15.47.
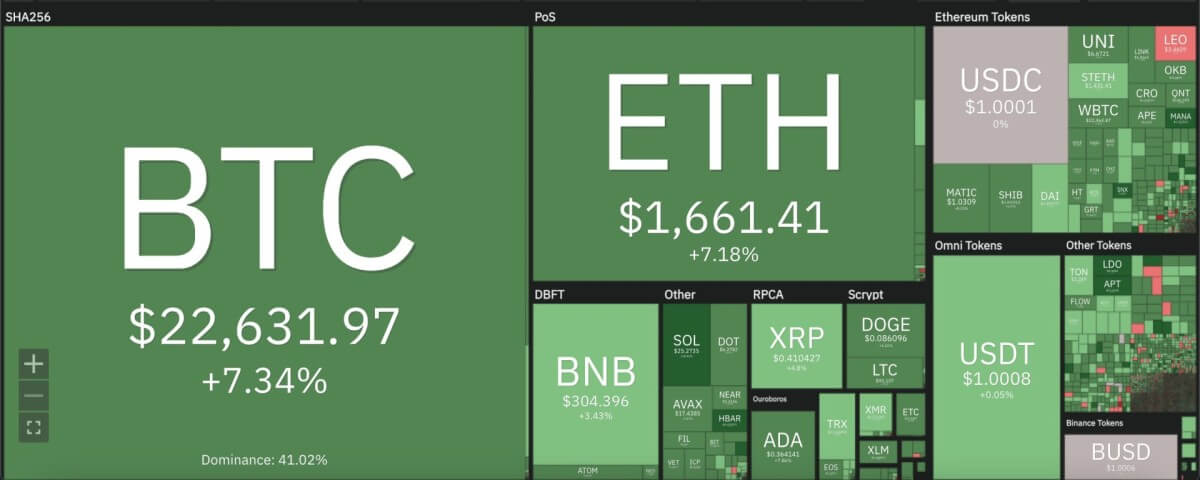
The larger cryptocurrency market showed all major cryptos making significant increments over the past 24 hours, led by Bitcoin’s rise up to $22,600 with a 7 percent uptrend. Ethereum also rose 7 percent to move up to $1,600, whereas leading Altcoins also showed similar trends. Ripple rose 5 percent, while Cardano jumped 7 percent, each settling at $0.41 and $0.36, respectively. Meanwhile, Dogecoin made a 6 percent increment to move as high as $0.08.

Avalanche price analysis: AVAX regains control over moving averages on daily chart
On the 24-hour candlestick chart for Avalanche price analysis, price can be seen making a surprise uptrend over the past 24 hours to move back above the $17 mark. Yesterday, price slipped down to $15.56 and below the 9 and 21-day moving averages. With today’s movement, price has regained position above the important 50-day exponential moving average (EMA) at $16.39.

The 24-hour relative strength index (RSI) can also be seen making a steep uptrend over the past 24 hours, after initially receding back to 66. With the RSI still within the overbought zone above the 70 mark, price could be set for a bigger correction over the next 24 hours. Meanwhile, the moving average convergence divergence (MACD) curve continues to show bullish potential for Avalanche price analysis as the signal line sits above the trend line.
Disclaimer. The information provided is not trading advice. Cryptopolitan.com holds no liability for any investments made based on the information provided on this page. We strongly recommend independent research and/or consultation with a qualified professional before making any investment decisions.


