The Avalanche price analysis is bullish for today as the price is rising after a bearish spell that lasted for three days. Overall, AVAX has maintained it’s price level since 13 November 2022 other then a dip observed on 20 November 2022, from which it recovered 23rd of this month. The recent bullish momentum started yesterday when bulls took control over the price function, at the end of the previous trading session, as the overall market was bearish throughout.
Even though yesterday’s price breakout was also upward, bearish pressure came in later in the day, and thereon the price closed in the red. Now that the price has been rising for 12 hours, the next level of resistance for AVAX is at $13.48.
AVAX/USD 1-day price chart: Bulls show weak momentum
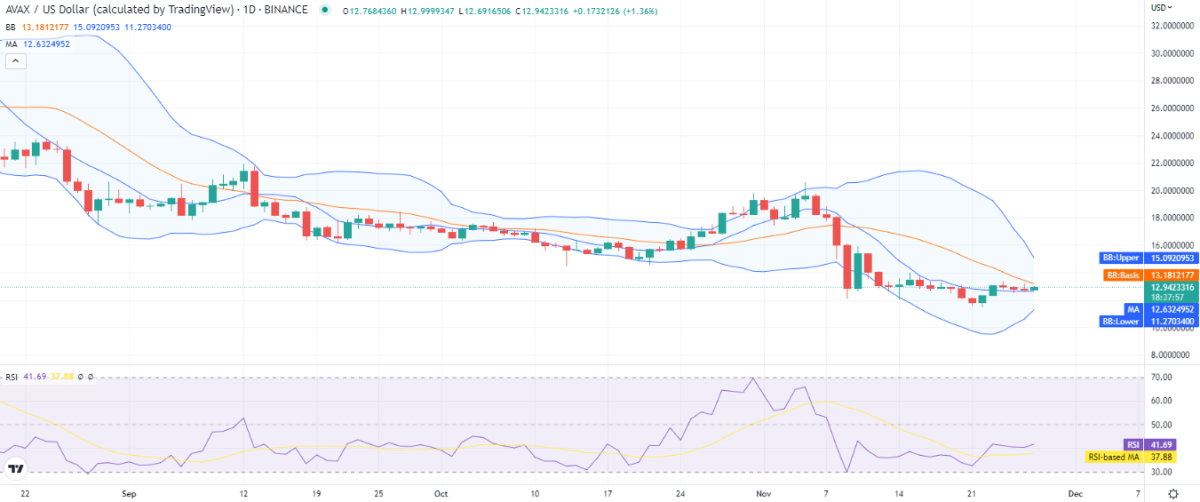
The bulls have made some progress today, according to the 1-day price chart for Avalanche price analysis. Because to the higher price movement, the AVAX value has returned to the $12.94 position. This is good news for the cryptocurrency pair because the coin’s value drastically dropped earlier this month as a result of the downturn. The moving average (MA) value, which is currently at $12.63, is still below the price. The relative strength index (RSI) curve, on the other hand, isn’t looking very good right now. It’s slightly skewed higher, suggesting either a sluggish bullish momentum or the emergence of strong negative forces.

The volatility for the AVAX/USD pair is decreasing, and the Bollinger bands are steeply converging, with the upper band present at the $15.09 mark, representing the resistance, and the lower band having traveled to the $11.27 mark, representing the support level for AVAX. On the contrary, the mean average of the indicator is present at the $13.18 mark above the current price level.
Avalanche price analysis: Recent developments and further technical indications
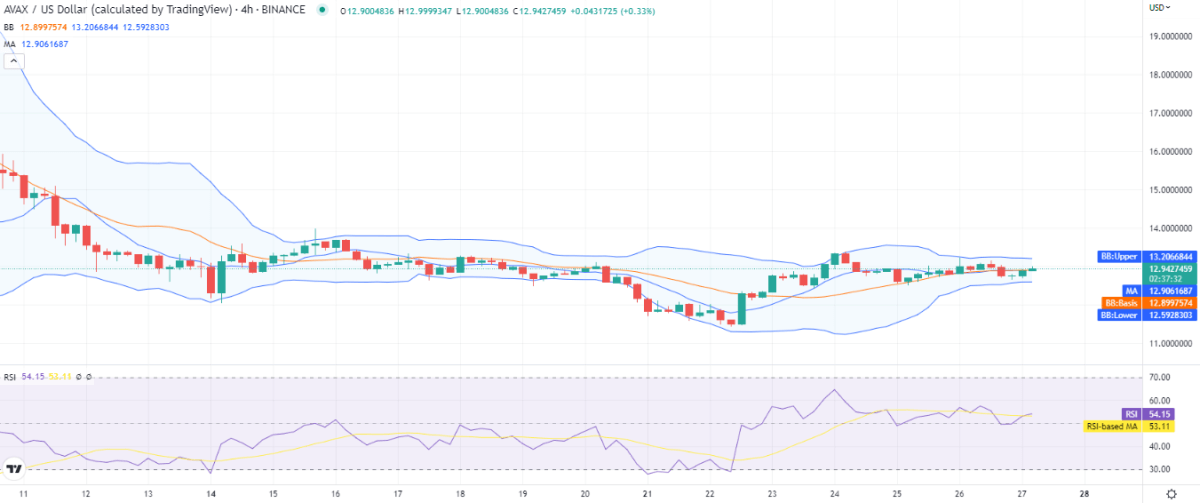
Given that the price has been rising over the past 12 hours, the 4-hour price chart for Avalanche price analysis also supports the bullish trend. The price has rebounded to $12.94 today after consistent bullish attempts, indicating a healthy overall recovery. The bullish trend may continue for the rest of the day as it has been seen during the previous four hours as well.

A correction could be coming, as the RSI is flattening out on the 4-hour chart and the RSI indicator suggests equal room for both sides. The Bollinger bands have converged and created a tight channel, which has reduced volatility on the 4-hour chart and raised the possibility that price oscillations will remain modest. Here, the indicator’s upper boundary at $13.20 signifies resistance, and its lower level at $12.59 shows support for AVAX.
Avalanche price analysis conclusion
Given that the price is still rising, the Avalanche price analysis is positive right now. Although the currency appears to be in a phase of consolidation, we do not anticipate any major breakthroughs. Although the bulls have been in the lead for the previous 12 hours, they lack the necessary momentum, as the RSI curve suggests.
Disclaimer. The information provided is not trading advice. Cryptopolitan.com holds no liability for any investments made based on the information provided on this page. We strongly recommend independent research and/or consultation with a qualified professional before making any investment decisions.


