Avalanche price analysis shows a continued downtrend in place for the cryptocurrency, with price lowering down to $13.85 over the past 24 hours. AVAX price has been stuck around the $14 support largely since the decline from $16.48 on May 8, its highest price in a month. With the persistent downtrend in place, AVAX resistance has come down to $15.5 with current level of price at $14.10. Avalanche trading volume dropped off further over the past 24 hours by around 10 percent, while market cap sits at $10,173,639,679.
The larger cryptocurrency market shows minor declines taking place across major cryptos over the past 24 hours. Bitcoin dropped 1 percent to move below the $27,000 mark, while Ethereum stays put at $1,800. Meanwhile, among leading Altcoins, Ripple dropped 1 percent to $0.50, and Cardano 3 percent to $0.36. Furthermore, Dogecoin price remains at $0.07, whereas Polkadot suffered a 2 percent decline to move down to $5.2.

Avalanche price analysis: Latest downtrend tests support on daily chart
On the 24-hour candlestick chart for Avalanche price analysis, price can be seen largely trending sideways around the $14 mark since May 9. In this month, AVAX has persistently shown bearish returns, resulting in significantly low market interest at current levels. The latest downtrend over the past 24 hours breached the $14 support, and could test it further. Current price moved below the 9 and 21-day moving averages, as well as the 50-day exponential moving average (EMA) at $14.43 over today’s trade.
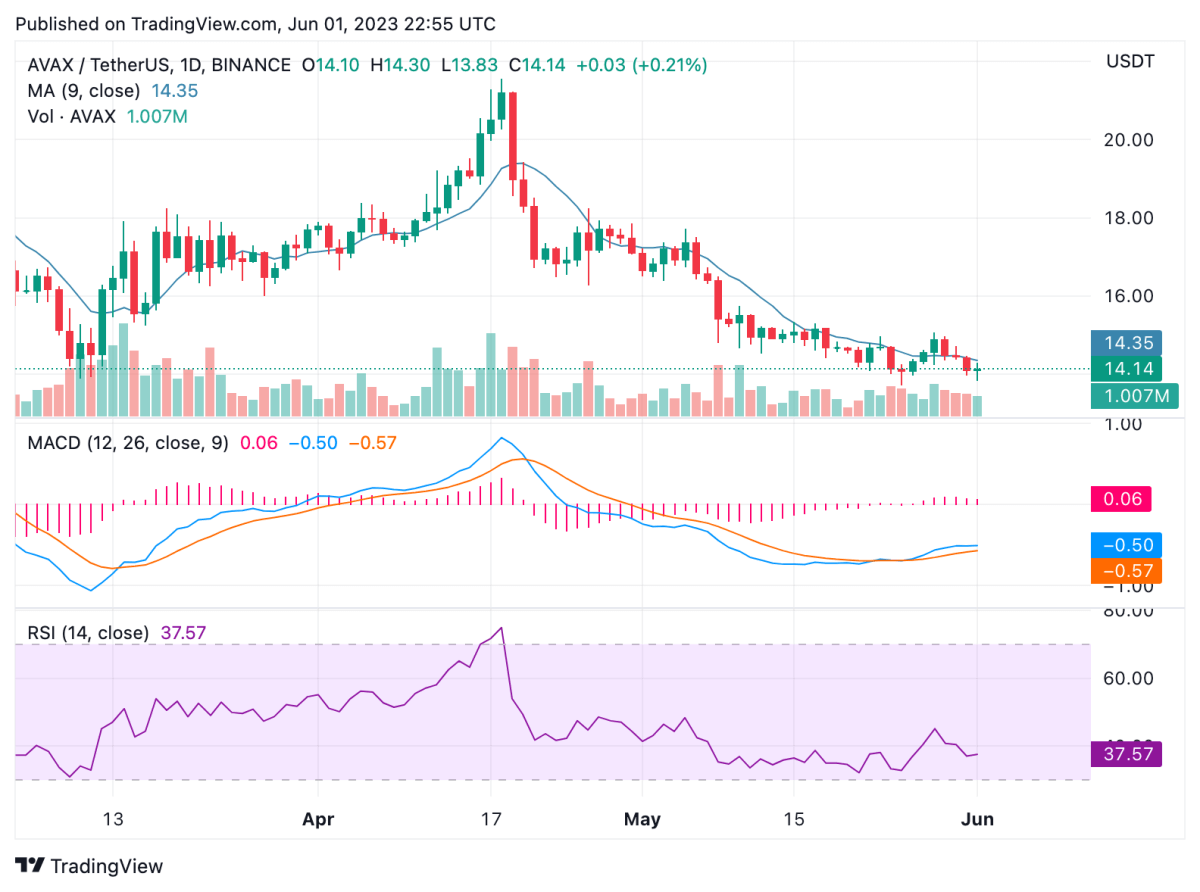
The 24-hour relative strength index (RSI) can also be seen taking a hit after initially moving into the 50’s. Current RSI shows low market valuation for AVAX at 37.57. Meanwhile, the moving average convergence divergence (MACD) curve also looks to be showing a bearish divergence, with the trend line close to lowering down the signal line for Avalanche price analysis.
Disclaimer. The information provided is not trading advice. Cryptopolitan.com holds no liability for any investments made based on the information provided on this page. We strongly recommend independent research and/or consultation with a qualified professional before making any investment decisions.