Avalanche price analysis shows a continued downward trend in place, as price dropped below the $15 support for the first time since March 12. During the current bearish spell, AVAX price has declined more than 29 percent since April 19, lowering to the support region at $15 overnight. While price continues largely to trend sideways, the dominant trend seems to be downward. AVAX technical indicators suggest continuation of the current bearish spell, apart from the 59 percent pick up in trading volume over the past 24 hours that could hint of a coming uptrend. However, price is expected to test support at $15 further before any move upwards.
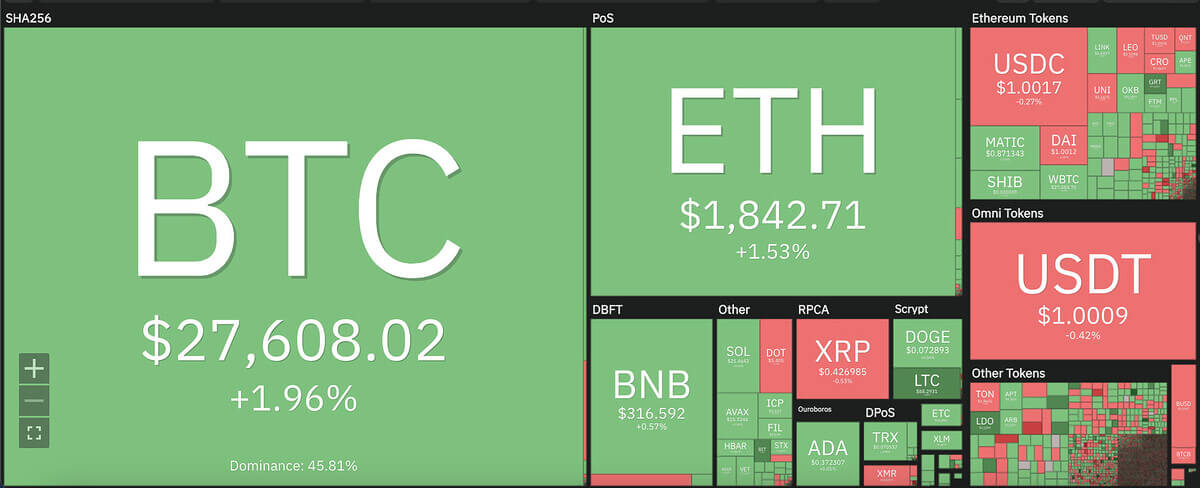
The larger cryptocurrency market showed mixed results across the board, as Bitcoin revived past $27,500 with a minor increment, and Ethereum rose up to $1,800 with an almost 2 percent uptrend. Among leading Altcoins, Ripple dropped to $0.42, whereas Cardano stayed at its previous price point of $0.37. Meanwhile, Dogecoin also consolidated at $0.07, with Polkadot also staying put at $5.4.

Avalanche price analysis: RSI picks up along with trading volume increase
On the 24-hour candlestick chart for Avalanche price analysis, price can be seen forming a downward descent since May 6, with a brief sideways trend initiating since the past week. With price largely remaining bearish, the 9 and 21-day moving averages remain clear of current price at $15.30, whereas the crucial 50-day exponential moving average (EMA) sits just above at $15.40.

The 24-hour relative strength index (RSI) seems to be picking up on the daily chart view, coupled with the 59 percent increase in trading volume. This could spell an upcoming trend reversal, with the next immediate resistance point set at $18. As Avalanche market value picks up, traders will look to come into the market, however vary of the support zone at $15. Meanwhile, the moving average convergence divergence (MACD) curve continues to show a bearish divergence, which could be flipped if price begins recovery.
Disclaimer. The information provided is not trading advice. Cryptopolitan.com holds no liability for any investments made based on the information provided on this page. We strongly recommend independent research and/or consultation with a qualified professional before making any investment decisions.


