Avalanche price analysis shows that the AVAX/USD pair is currently in a bullish trend, with prices rising steadily above $18.63. This indicates that buyers are in control of the market and are likely to push prices higher in the near future. The resistance level is seen at $18.72, which if broken could lead to a further increase in prices. The support level is at $17.24, which if breached could lead to a drop in prices. However, this bullish trend has been further reinforced by the increased trading volume of AVAX, which is currently at $472 million and whose market capitalization is trading at $5.8 billion.
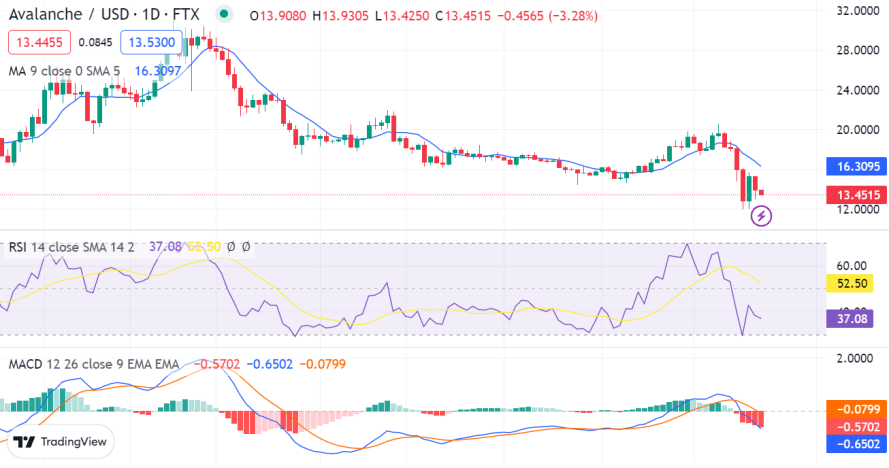
Avalanche price analysis on 1-day chart: AVAX/USD price is over $18.63, indicating a bullish advance.
The one-day Avalanche price analysis shows that the AVAX/USD pair is still in an uptrend, which could increase further if buyers remain in control. The bulls have been dedicated to regaining their leading position as they have been pushing prices higher and higher. Considering the current market conditions, it is likely that AVAX could reach the $19 mark in the near future.

The moving average convergence and divergence (MACD) indicator also signals a bullish trend, with its histogram extending above the zero line. This indicates that buying pressure is strong and that prices could continue to rise in the near future. The relative strength index (RSI) indicator is also in bullish territory, supporting this trend’s continuation. Furthermore, the moving average has crossed over the 50-day MA and is now trading above it. This reflects an increase in buying pressure, which could lead to further price appreciation.
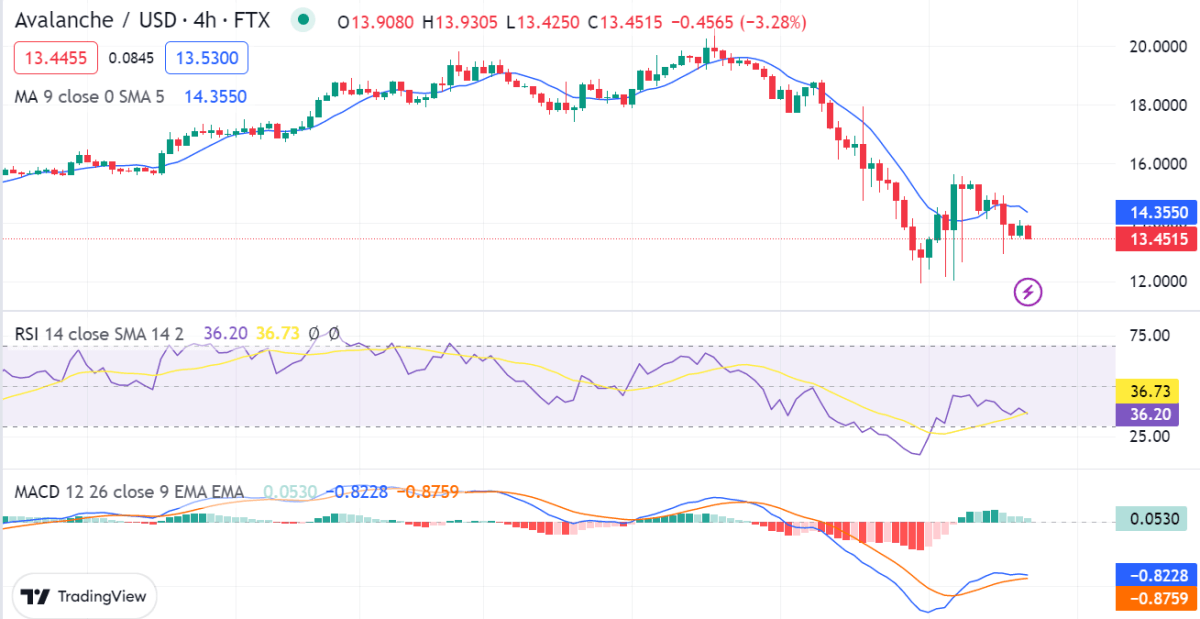
AVAX/USD 4-hour price chart: Recent updates
The 4-hour Avalanche price analysis shows that the AVAX/USD pair is still in an uptrend, which could increase further if buyers remain in control. On the 4-hour chart, Avalanche price analysis has formed a bullish flag pattern. This is a continuation pattern that indicates that the current uptrend is likely to continue. The bears may attempt to push prices lower in the near future, but the bulls are likely to defend the $18.63 level, which is the bottom of the flag pattern.

The 20-day EMA is also above the 50-day EMA, which is another confirmation of the bullish trend in the market. The moving average convergence and divergence (MACD) indicator is showing a bullish crossover since the MACD line (blue) is above the signal line (orange). Moreover, the relative strength indicator (RSI) is in the overbought region at 36.73, which further confirms a slight increase in price.
Avalanche price analysis conclusion
In conclusion, Avalanche price analysis demonstrates that the bulls are in charge of the market and will probably keep driving prices higher in the near future. The technical indicators support the bulls as well. Therefore, we may anticipate a near-term increase in price, with the level of $18.63 as the next objective.


