Avalanche price analysis indicates the emergence of a bullish trend that is progressively gaining strength, with substantial potential for further upward movement. The AVAX/USD trading pair is currently priced at $14.5, indicating a 2.69% increase in value over the past 24 hours. There was a significant upward trend observed in the market yesterday, marked by a sudden surge. However, at the beginning of the current day, the market exhibited promising bullish behavior after declining below the $14 level. Additionally, market volatility has decreased, creating a favorable environment for potential recovery favored by bullish investors.
Avalanche’s present trading value stands at $14.56, accompanied by a 24-hour trading volume of $214.83M. It possesses a market capitalization of $4.87B, with a market dominance of 0.42%. Over the past 24 hours, the price of AVAX has observed a 2.26% increase. Currently, the sentiment surrounding Avalanche’s price prediction leans towards a bearish outlook, while the Fear & Greed Index indicates a neutral sentiment with a score of 50.
Avalanche’s circulating supply presently amounts to 334.60M AVAX tokens out of a maximum supply of 720.00M AVAX. The yearly supply inflation rate currently stands at 19.24%, resulting in the creation of 54.00M AVAX tokens within the past year. In terms of market capitalization, Avalanche holds the seventh position in the Proof-of-Stake Coins sector, the top spot in the Avalanche Network sector, and the eleventh spot in the Layer 1 sector.
AVAX/USD 1-hour analysis: Latest developments
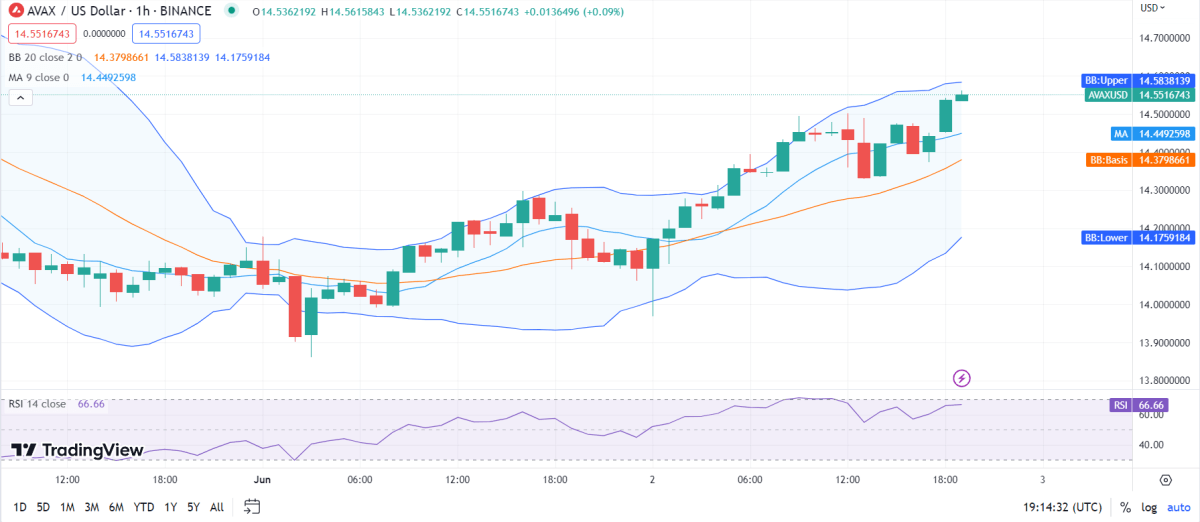
Avalanche price analysis indicates an increasing trend in market volatility, indicating that the AVAX/USD prices are becoming less stable and more prone to large swings. Presently, AVAX is facing a notable resistance level at $14.5, which is evident from the upper boundary of the Bollinger Bands. This resistance level suggests that there is selling pressure around that price point, making it challenging for AVAX to surpass it. On the other hand, the lower boundary of the Bollinger Bands at $14.1 is acting as a support level for AVAX.
The AVAX/USD price has recently crossed over the Moving Average curve, signaling a bullish trend in the market. The presence of bearish activity has been noticeable in the preceding hours, and it is anticipated to continue as the price approaches the support level. This implies the possibility of a market breakout, underscoring the prevailing bearish sentiment.

Avalanche price analysis reveals the Relative Strength Index (RSI) currently sits at 66, indicating that the cryptocurrency is unstable. Moreover, the RSI has been trending linearly within the overvalued range, implying the equivalence of selling activities in the market. If the RSI continues its stable movement and moves further into a downward state, it may suggest a potential continuation of the bearish sentiment.
Avalanche price analysis for 1-day
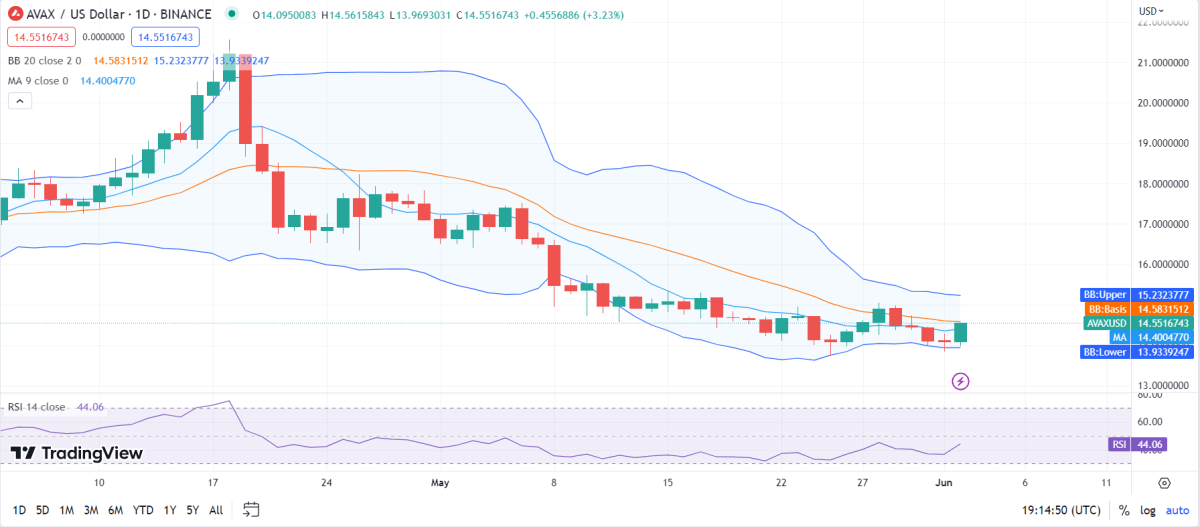
Avalanche price analysis reveals a diminishing trend in market volatility, implying a reduced likelihood of significant fluctuations in the AVAX/USD pair as volatility increases. The upper limit, currently set at $15.2, represents a prominent resistance level, signifying a substantial obstacle to AVAX’s upward trajectory. Conversely, the lower limit, situated at $13.9, functions as a robust support level, offering a solid foundation for AVAX’s price during downturns.
The current movement of the AVAX/USD price exhibits a bullish trend, characterized by its crossover above the Moving Average curve. Despite a period of relative stability in the market, bullish sentiment has gained prominence, thereby weakening the position of bearish traders. Furthermore, the AVAX/USD price surpassing the Moving Average indicates a potential move toward the resistance band. Presently, the price is following an upward trajectory, indicating stable movement at the time of writing.

According to the Avalanche price analysis, the current Relative Strength Index (RSI) of 44 indicates that the cryptocurrency is central neutral. With the price showing an upward trajectory within the lower neutral range, accompanied by dominant buying activity, there is potential for a significant market reversal and a shift toward a bullish trend.
Avalanche Price Analysis Conclusion
Avalanche price analysis indicates a strong bullish trend, which means that the price has been generally increasing over a certain period of time. This suggests positive market sentiment and buying pressure from investors. However, it’s important to note that markets are dynamic and can change direction. If the reversal level is surpassed, it means that the price may experience a significant decline or a reversal of the current trend. This could occur if selling pressure increases and outweighs buying pressure, leading to a shift in market sentiment.


