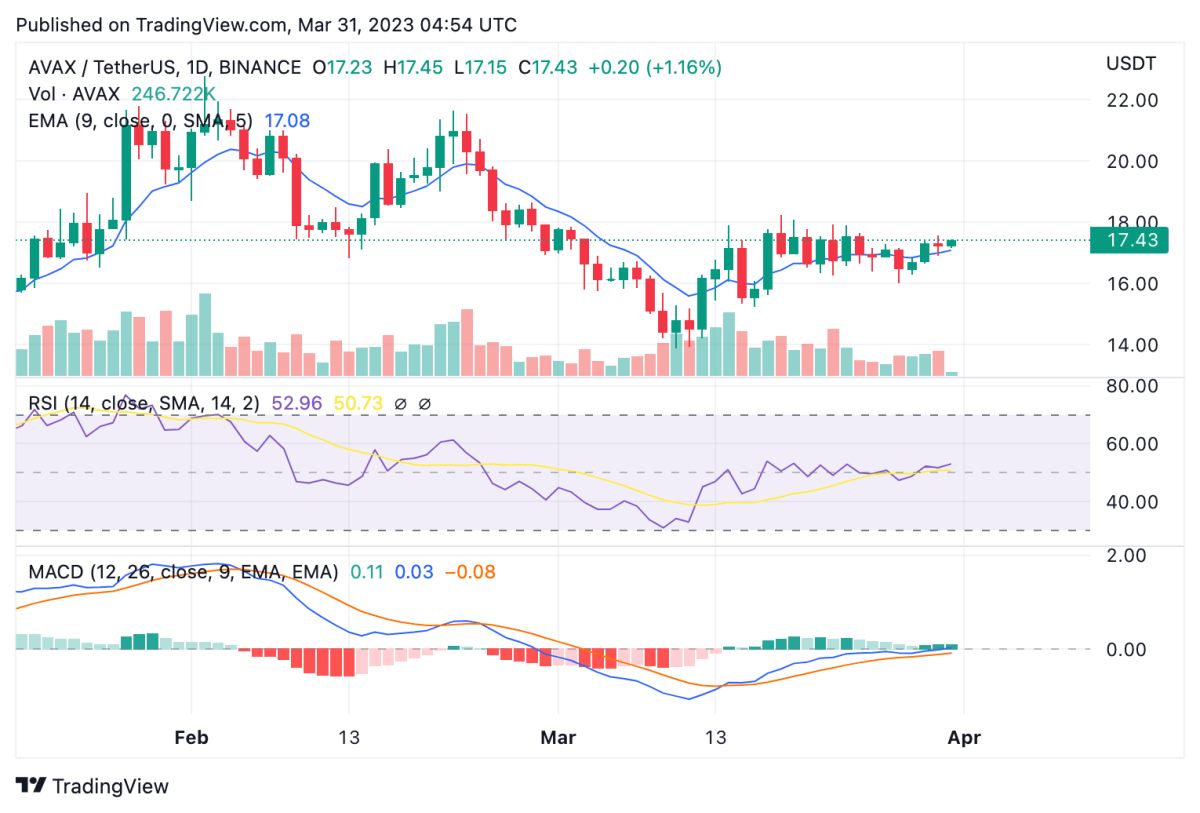
Avalanche price analysis shows a continued uptrend forming on the daily chart, as the token continues to chase the $20 resistance. Price rose up to $17.5 over the past 24 hours after gradually increasing since March 27. Earlier in the month, lows of $14.2 were recorded, compelling the idea that the $20 mark would remain beyond reach. However, AVAX continues to chase the resistance point, with support upping to the $16 mark. Avalanche dropped to the 16th rank in the cryptocurrency market, with a market cap of $12,524,701,416.
The larger cryptocurrency market displayed minor uptrends from the last 24 hours, with the exception of Bitcoin’s 2 percent downtrend to pull price down to $28,200. Ethereum rose 1 percent to sit at $1,800, whereas major Altcoins mimicked this trend. Ripple upped 2 percent to reach $0.53, while Dogecoin remained at $0.07. Meanwhile, Cardano rose up to $0.37, and Polkadot also continued to sit at its previous price of $6.2.

Avalanche price analysis: Strong RSI shows promising signs on the daily chart
On the 24-hour candlestick chart for Avalanche price analysis, price can be seen forming a gradual upturn, after dropping below the earlier support at $15. With the steady revival in place currently, AVAX has moved above its 9 and 21-day moving averages on the daily chart, along with the crucial 50-day exponential moving average (EMA) at $17.06. The 24-hour relative strength index (RSI) can also be seen on the up, moving up to the 53 mark to indicate stronger market valuation. Meanwhile, the moving average convergence divergence (MACD) curve also shows the trend line sitting above the signal line, another positive indicator for price movement ahead.

Disclaimer. The information provided is not trading advice. Cryptopolitan.com holds no liability for any investments made based on the information provided on this page. We strongly recommend independent research and/or consultation with a qualified professional before making any investment decisions.


