The most recent Avalanche price analysis shows bearish results as the price underwent losses again. The price has decreased up to $12.71, continuing the downtrend that started on the 18th of November. The short-term trending line is still in the red, which means that the bears are in the leading position as the cryptocurrency’s value has decreased by more than 3.25%. The 24-hour trading volume for AVAX/USD has decreased to $110,863,686, and the market capitalization is currently at $3,824,009,214. The AVAX/USD pair support is currently at $12.56, while the resistance is at $13.21
AVAX/USD 1-day price chart: AVAX price falls to $12.71 as selling pressure builds
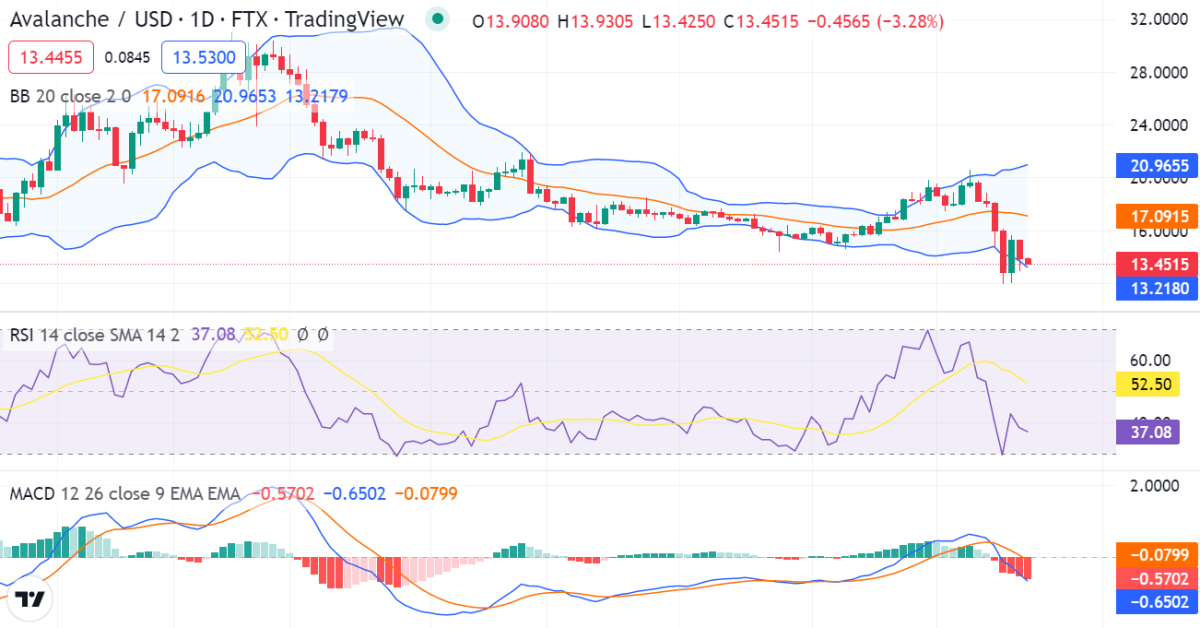
The 24-hour Avalanche price analysis shows the price has decreased again after increasing in yesterday`s late hours. The AVAX/USD pair is trading hands at $12.71 at the time of writing as the bears are leading the price function, the AVAX shows a decrease in value by 2.75 percent over the last 24 hours. The trading volume decreased by over 30 percent making the crypto pair rank at position 20 recently. On the technical front, the Relative Strength Index score is at 36.31 which indicates that the selling pressure is on a high note. The bands of the Bollinger band indicator are seen to be diverging revealing an increase in volatility.

The upper band is at $20.88 while the lower one is placed at $10.33. On the other hand, the Moving Average Convergence Divergence (MACD) indicator is in the red zone with the MACD line below the signal line. This shows a strong bearish action.
AVAX/USD 4-hour price chart: Recent developments and further technical indications
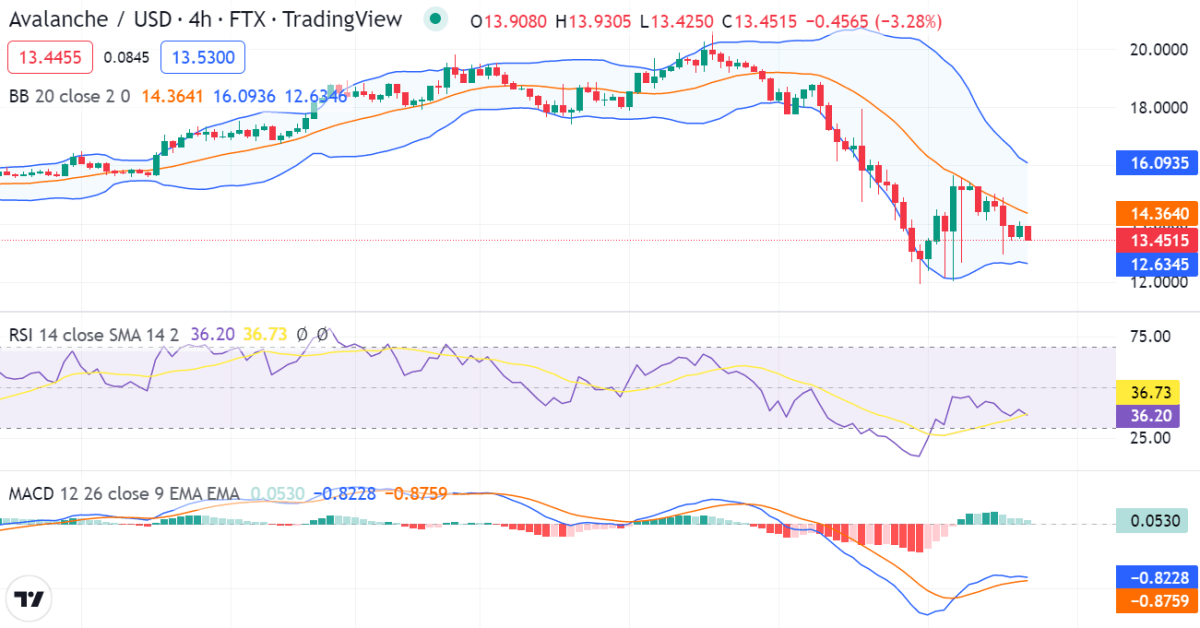
The 4-hour Avalanche price analysis shows that the price breakout was higher at the start of the trading session, but the price function swung downwards four hours earlier. The upper Bollinger band is now at $13.39, whereas the lower Bollinger band is situated at the $12.68 level, if the downfall continues, then soon the price will travel below the lower band.

The RSI score is going towards decline as well and is at the lower than average position of index 39.84, quite near the undersold region. The Moving Average Convergence Divergence indicator also has some red traces indicating that the bears are slightly holding on to their position.
Avalanche price analysis conclusion
After a continual price decline since yesterday, the bears are attempting to maintain their advantage once more. The AVAX/USD price has fallen to a level of $12.71, indicating a decline in price. Given that the four-hour price analysis likewise reveals minimal positive momentum, we should anticipate a downward price movement in the hours to come.
Disclaimer. The information provided is not trading advice. Cryptopolitan.com holds no liability for any investments made based on the information provided on this page. We strongly recommend independent research and/or consultation with a qualified professional before making any investment decisions.


