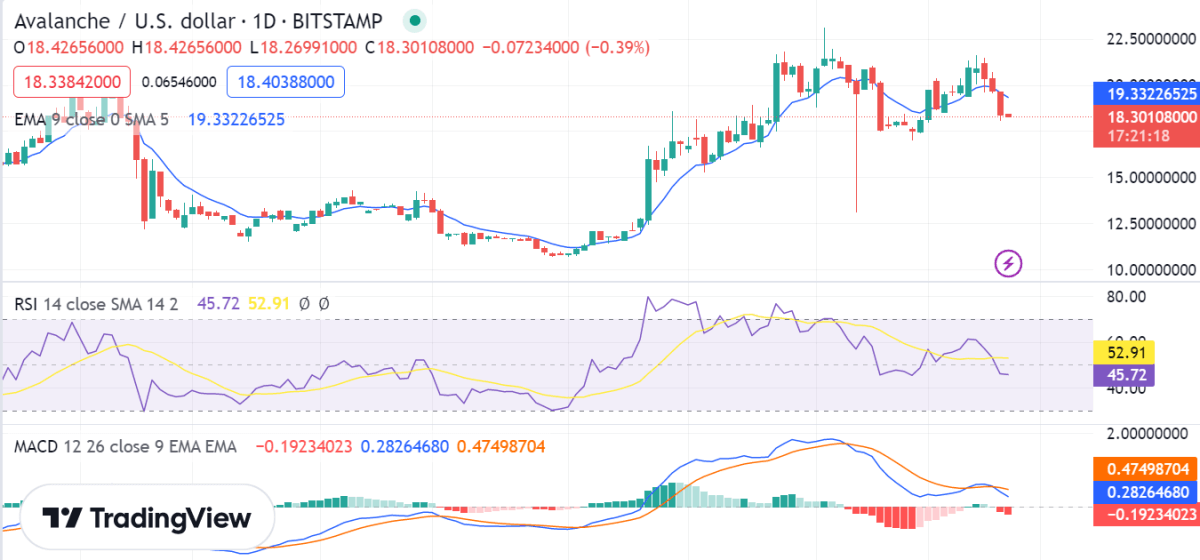
Avalanche price analysis confirms a solid bearish trend for the market as the price has fallen to the lowest level at $18.26. This is a critical situation for the buyers as the current market conditions are volatile and unpredictable, and the probability of further losses is high. Support for the AVAX/USD pair is at $18.14, if prices manage to break under this level, it could open the door for a further decline. On the other hand, if prices rebound above $19.68, it could be a sign of bullish pressure and the beginning of a new uptrend. Investors should keep an eye on the market and adjust their positions accordingly to take advantage of any potential upside in the market.
Avalanche price analysis 1-day chart: Bears gain grip as AVAX/USD breaches crucial support at $18.14
Looking at the technical analysis on the daily chart, AVAX shows that the bears are in the leading position as an intense selling activity has been taking place today. Although the market was under the control of the buyers yesterday, the bears have managed to take over and push AVAX prices lower. The bears have maintained their lead quite efficiently by bringing the price down to the $18.26 level. The price might move towards a new low, and the bearish momentum seems to be intensifying every hour.

The Relative Strength Index (RSI) is currently at 52.91, which is in the neutral zone, indicating a lack of momentum for both the bulls and bears. The Moving Average Convergence Divergence (MACD) shows that bearish momentum is growing as the MACD line (blue) crosses below the signal line. The exponential moving average (EMA) is flat, which suggests the price is trading in a range.
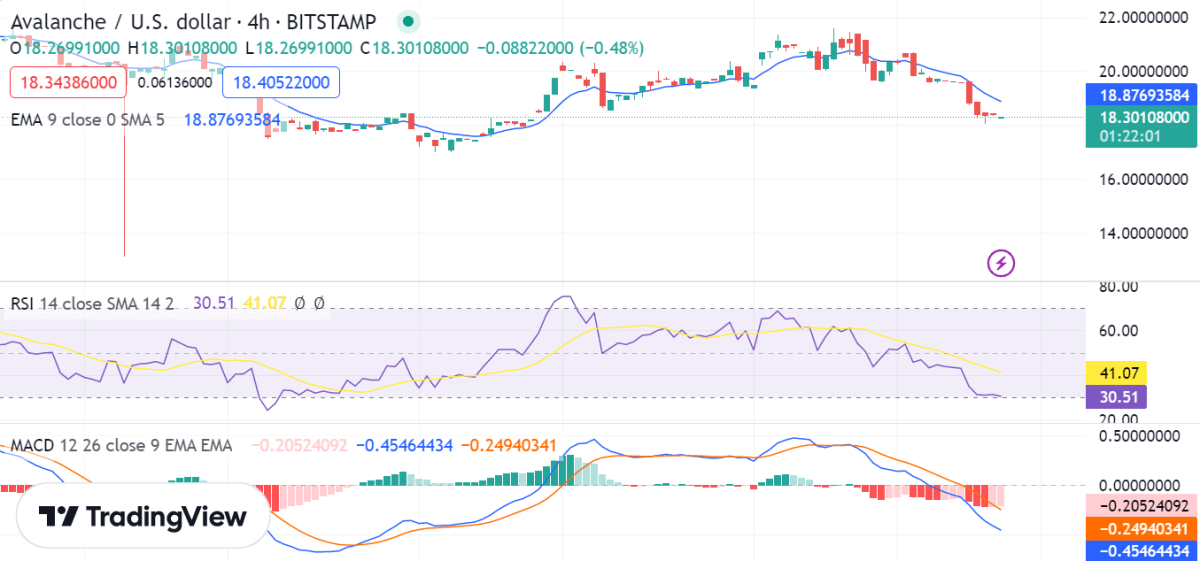
AVAX/USD 4-hour price chart: Recent developments and further technical indications
In the 4-hour Avalanche price analysis, it can be seen that prices have been trading in a tight range between $18.22 and $18.26.The market value of AVAX/USD has dropped to $18.26, losing 6.80 percent more because of the downward trend. The bears have been overruling the bulls for the past few hours by securing consecutive wins. The 24-hour trading volume has increased by over 2.19% and is now at $290 million, while the market capitalization for AVAX/USD is currently trading at $5.7 billion.

Furthermore, the moving average convergence and divergence (MACD) also show bearish pressure as the MACD line has crossed below the signal line. Additionally, the EMA is flat, which suggests that the pair is facing consolidation. Moreover, the relative strength index (RSI) is currently at 41.07, indicating that the market is bearish but lacks the momentum to continue the downward trend.
Avalanche price analysis conclusion
To conclude, AVAX/USD is currently in a bearish trend and could drop lower if prices break below $18.14. On the other hand, if prices rebound above $19.68, it could be a sign of a reversal in the trend and could lead to higher prices. Thus, investors should keep a close eye on the market and adjust their positions accordingly to take advantage of any potential upside in the market.


