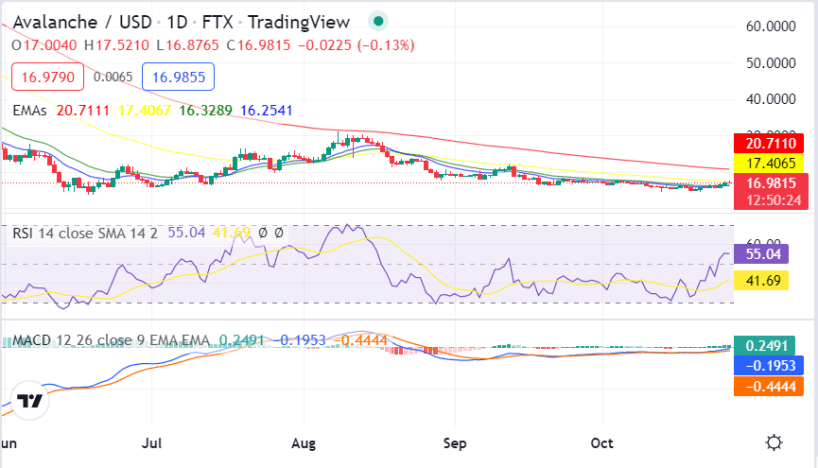
Avalanche price analysis shows that selling pressure has been increasing in recent days, pushing AVAX prices below $17.00. Key support levels have been set at $16.90, but if these levels break, we could see further downward movement in Avalanche prices. Resistance for AVAX is currently at $17.48, however, if buying pressure returns, we could see a push toward $18.00.
Yesterday bulls were in control of the market as AVAX prices peaked at $17.84, but the current bearish sentiment has brought prices down to their current levels. The market is down by 1.39% in the past 24 hours and down by 4.65% in the past 7 days.
Avalanche price analysis on a 1-day price chart: Bears take control as prices break below $17.00
The daily Avalanche prices have been quite aggressive over the past few hours as prices slipped to levels below $17.00 and currently trading at $17.04 at the time of writing. The market has formed a descending triangle pattern, with the lower trendline acting as support. If this support level breaks, we could see further downward movement in AVAX prices.

The exponential moving averages are indicating a bearish sentiment as the 50 EMA is below the 100 EMA. The RSI is showing that the market is currently oversold, with a value of 41.69. A break above 50 on the RSI could indicate that buying pressure has returned to the market. The MACD indicator on the daily chart is also showing bearish momentum as the signal line has crossed below the MACD line.
AVAX/USD 4-hour price analysis: Prices head lower as the selling pressure continues
The four hours Avalanche price analysis is displaying quite negative results for the buyers as the price underwent a significant decline in the past few hours. The bearish rally has resulted in the price going below the $17.04 level. Although considerable signs of recovery from the bullish side were observed earlier, the last few hours again proved favorable for the bears.

The 50 EMA is at $16.82 and below the 100 EMA at $16.21, indicating that the bearish pressure is in control of the market. The Relative Strength Index (RSI) has also dipped below the 64.97level, showing that the market is currently in oversold territory. However, if the RSI moves below 50, it could signal a shift in momentum and the potential for buying pressure to go down. The histogram of the MACD indicator shows that bearish momentum is decreasing.
Avalanche price analysis conclusion
To sum up today’s Avalanche price analysis, we can see that the market is in a clear bearish trend. Prices have been falling consistently over the past few days and today the intraday lows were reached at $17.04. The market looks like it is headed for further losses in the near term as the technical indicators are currently showing bearish signals.
Disclaimer. The information provided is not trading advice. Cryptopolitan.com holds no liability for any investments made based on the information provided on this page. We strongly recommend independent research and/or consultation with a qualified professional before making any investment decisions.


