Today Avalanche price analysis is showing a heightening momentum from the bullish side. The price levels have covered an upwards range, as the bullish momentum has proved to be quite steady. The price levels have returned to $20.49, their former high, causing the bearish control to collapse for the moment. The support levels are also rising above $19.25 and may reach a new height soon if the bullish momentum strengthens even further.
AVAX/USD 1-day price chart: Bulls continue to dominate as Avalanche price nears $19.52
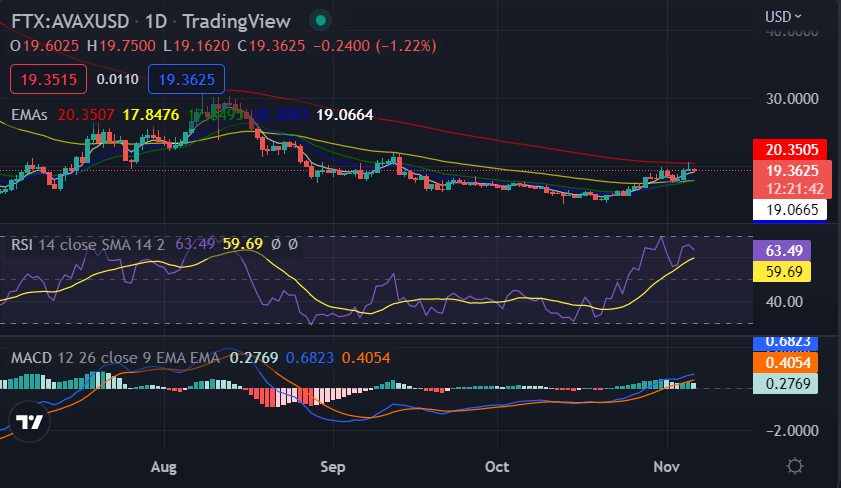
The 1-day Avalanche price analysis is displaying encouraging signs for the buyers and motivating them to further add to the asset value. The previous week saw a slight uptrend in the price levels, but the current bullish momentum has managed to push it higher. AVAX’s price has reached $19.52 at the time of writing, gaining 0.83 percent value during the last 24 hours.

The RSI indicator is currently at the 59.69 level, which indicates that the market is neither overbought. A move to the oversold territory is highly unlikely in the near term as the buyers continue to dominate and maintain control over the market. Similarly, the MACD levels are showing increasing bullishness with a strong green histogram. The signal line is above the MACD line, indicating a buying opportunity for investors. The Exponential Moving Average (EMA)is currently at $19.25, providing support to the bulls in the market.
Avalanche price analysis: Recent developments and further technical indications
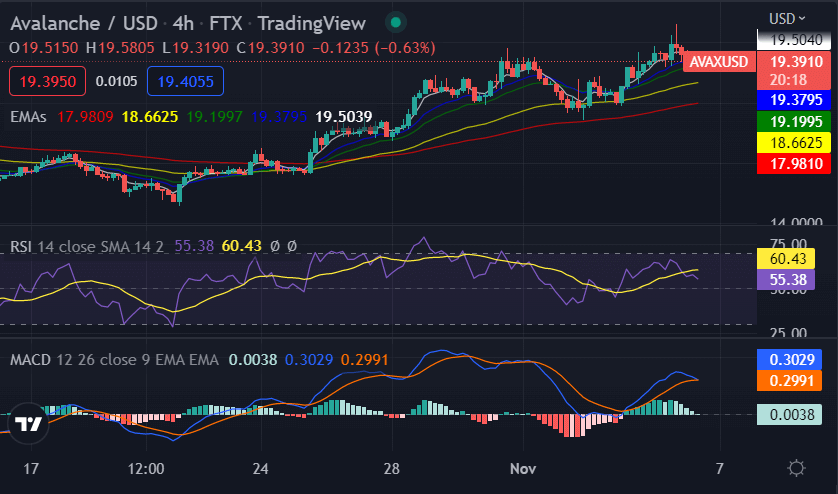
The 4-hour price chart for Avalanche price analysis shows that the cryptocurrency has encountered a bullish strike and has succeeded in breaking above the $19.52 level. This move has seen the AVAX/USD pair target the $20.49 resistance level, which it is currently facing. The bulls on the hourly chart seem to be taking a break, and the price may decline slightly before further attempts to breach this level.

On the technical front, the Relative Strength Index (RSI) is in the overbought territory at 60.43, suggesting that a minor correction may occur in the near term. However, the Moving Average Convergence Divergence (MACD) indicator shows increasing bullishness as the MACD line crosses above the signal line. The EMA indicator on the 4-hour chart is at $19.50.
Avalanche price analysis conclusion
From the Avalanche price analysis, it is evident that the bulls are taking the lead again. The momentum has been huge and has swept past the bears with a surprising rise in price, taking the value to $19.52. The current resistance at $20.49 may prove to be a challenge, but with the technical indicators indicating bullish market conditions, it can potentially be breached in the nearer future.
Disclaimer. The information provided is not trading advice. Cryptopolitan.com holds no liability for any investments made based on the information provided on this page. We strongly recommend independent research and/or consultation with a qualified professional before making any investment decisions.


