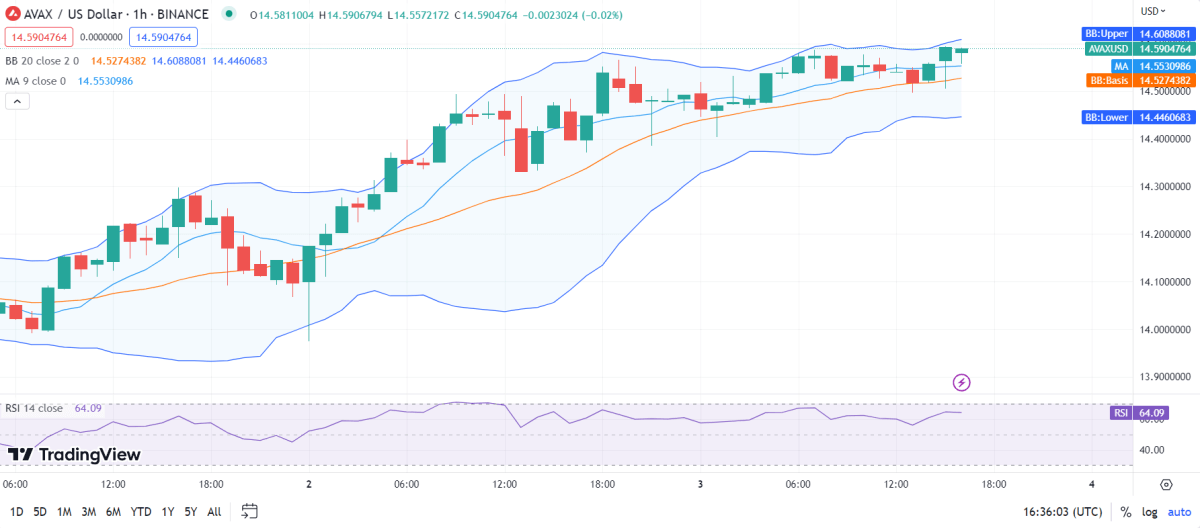
Avalanche price analysis indicates the emergence of a bullish trend that is progressively gaining strength, with substantial potential for further upward movement. The AVAX/USD trading pair is presently valued at $14.5, denoting a 1.14% appreciation in worth over the preceding 24-hour period. The market experienced a notable upward trajectory yesterday, characterized by a sudden surge in prices. Nonetheless, at the onset of the current day, the market demonstrated encouraging bullish tendencies following a dip below the $14 threshold. Moreover, there has been a reduction in market volatility, establishing a conducive milieu for potential recuperation that is welcomed by bullish investors.
As of today, the price of Avalanche (AVAX) stands at $14.59, accompanied by a 24-hour trading volume of $152.68 million. The market capitalization of Avalanche is $4.88 billion, with a market dominance of 0.42%. Over the past 24 hours, the AVAX price has witnessed a 1.14% increase. The current sentiment surrounding Avalanche’s price prediction is bearish, while the Fear & Greed Index indicates a neutral value of 53.
Regarding its supply metrics, Avalanche currently has a circulating supply of 334.60 million AVAX tokens out of a maximum supply of 720.00 million AVAX tokens. The yearly supply inflation rate is presently 19.17%, resulting in the creation of 53.83 million AVAX tokens in the past year. In terms of market capitalization, Avalanche is ranked #7 in the Proof-of-Stake Coins sector, #1 in the Avalanche Network sector, and #11 in the Layer 1 sector.
AVAX/USD 1-hour analysis: Latest developments
Avalanche price analysis reveals a growing trend in market volatility, indicating an increase in price fluctuations and reduced stability for the AVAX/USD trading pair. Currently, AVAX is encountering significant resistance at the price level of $14.6, which is evident from the upper boundary of the Bollinger Bands. This resistance level suggests the presence of selling pressure, creating a barrier for AVAX to surpass and advance further. Conversely, the lower boundary of the Bollinger Bands at $14.4 is acting as a support level, offering some stability and preventing AVAX from declining below that point.
In recent developments, the AVAX/USD price has exhibited a notable crossover above the Moving Average curve, indicating a bullish trend in the market. However, it is important to note that there has been observable bearish activity in the preceding hours, which is anticipated to persist as the price approaches the support level. This suggests the potential for a market breakout, emphasizing the prevailing bearish sentiment in the current market conditions.

The analysis of Avalanche’s price shows that the Relative Strength Index (RSI) is currently at 64, indicating instability. The RSI has been declining within the overvalued range, indicating a prevalence of selling activities. If the RSI continues its downward trend and moves further into bearish territory, it may signal a continuation of the bearish sentiment in the market.
Avalanche price analysis for 1-day
Avalanche price analysis indicates a decrease in market volatility, reducing the probability of significant fluctuations in the AVAX/USD pair. The resistance level at $15.1 presents a notable barrier to AVAX’s upward movement, while the support level at $13.9 provides a strong foundation during market downturns.
At present, the AVAX/USD price is displaying a bullish trend as it has crossed above the Moving Average curve. Despite a period of stability, bullish sentiment has gained strength, weakening the position of bearish traders. Moreover, the price surpassing the Moving Average suggests a possible move toward the resistance band. Currently, the price is on an upward trajectory, indicating stable movement at the time of writing.

Avalanche price analysis reveals that the current Relative Strength Index (RSI) stands at 44, indicating a state of central neutrality for the cryptocurrency. The price is displaying an upward trajectory within the lower range of neutrality, accompanied by prominent buying activity. This suggests the possibility of a substantial market reversal and a shift towards a bullish trend.
Avalanche Price Analysis Conclusion
Avalanche price analysis reveals a robust bullish trend, indicating a general upward movement over a specific timeframe. This reflects positive market sentiment and significant buying pressure from investors. Nonetheless, it is crucial to recognize that markets are dynamic and subject to change. If the reversal level is breached, it implies the potential for a substantial decline or a reversal in the prevailing trend. Such a shift could transpire if selling pressure intensifies and surpasses buying pressure, resulting in a change in market sentiment.


