Avalanche price analysis shows AVAX is still stuck in a bearish sentiment that is cutting through the entire cryptocurrency market. Despite the recovery observed in Bitcoin and Ethereum, AVAX has failed to follow suit and has been trading sideways since the earlier opening of the daily chart.
Avalanche price analysis indicates the pair is currently trading in a descending channel defined by $11.0 as short-term support and $12.5 as significant resistance. A breakout above this level could signal a potential upside potential while a breakdown below the $11.0 threshold could lead to a further price decline.

AVAX/USD price action on a daily chart: Bearish sentiment remains intact
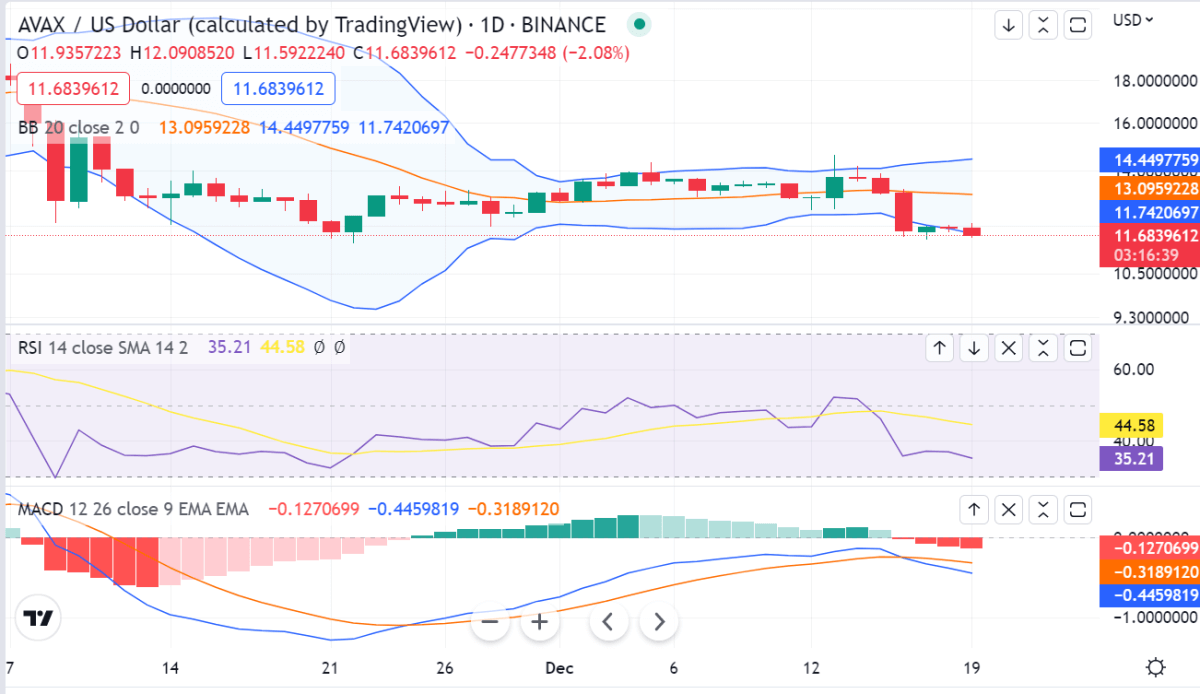
The AVAX/USD pair is currently trading at $11.70, down by 2.04 on the day. Avalanche price analysis shows the price action has been in a channel since the daily opening of the chart and it reached its peak around $14.11 last week. Since then, there has been a steady decline as the bearish sentiment that affects the entire cryptocurrency market continues to take hold.
The technical analysis shows AVAX is trading below the 23.6% Fibonacci retracement level of the recent uptrend, indicating that the bearish momentum could continue and push prices lower toward $11.0 as short-term support. A breakdown below this level could open up for further losses with targets set at $10.30 and then $9.90.

Looking at the moving averages, the 20-day EMA is currently at $11.78, indicating that the overall trend remains bearish and could continue to push prices lower in the near term. The RSI has dropped below 50, confirming that the downtrend will remain intact unless there are major bullish catalysts.
Avalanche price analysis on a 4-hour chart: AVAX stuck in a bearish channel
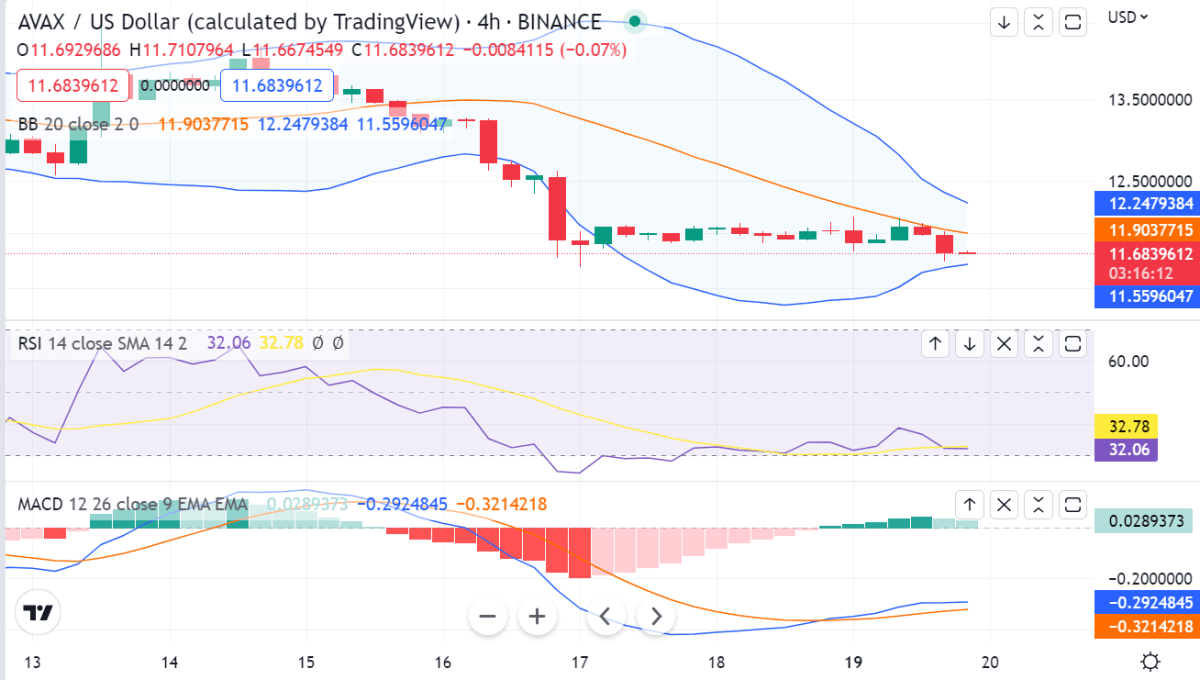
On the 4-hour chart, Avalanche price analysis indicates AVAX has been dormant in a bearish channel since the opening of the chart. The current support level is placed at $11.30 below which prices could slide further towards $10.90 and then $10.50 as the next target levels.

The oscillators are also indicating bearish signals, with the RSI below 40 and MACD declining sharply. This suggests that despite the recent recovery seen in most of the major digital assets, AVAX will remain weak unless there is a major surge in buying pressure.
Avalanche price analysis conclusion
In conclusion, Avalanche price analysis shows AVAX continues to trade lower within a descending channel as the bearish sentiment in the cryptocurrency market persists. Technical indicators, including the RSI and MACD, are reflecting a bearish trend and hinting at further losses in AVAX/USD pair. The immediate support level is placed at $11.30 while resistance is around $12.50.


