Avalanche price analysis shows that the AVAX/USD pair is currently in a bullish trend. The pair has formed higher highs and higher lows, indicating that the buyers are in control. The price is now facing resistance at the $17.75 level, which is a key hurdle for the bulls. If they can break above this level, it would confirm that the current trend is likely to continue. On the other hand, if the price fails to break above this level, it could see some selling pressure that could push it back down toward its previous support level. The digital asset is up by 1.20 percent over the past 24-hour period and is currently trading at $17.58.
Avalanche price analysis 1-day chart
The 1-day Avalanche price analysis indicates that the AVAX/USD pair is in a strong bullish trend. The bulls have been pushing the price higher, but they have failed to break above the $17.75 resistance level. The AVAX/USD pair is currently trading near the $17.58 level, which is above the key support area. If the bulls can keep the price above this level, it could signal further upside potential in the near future.
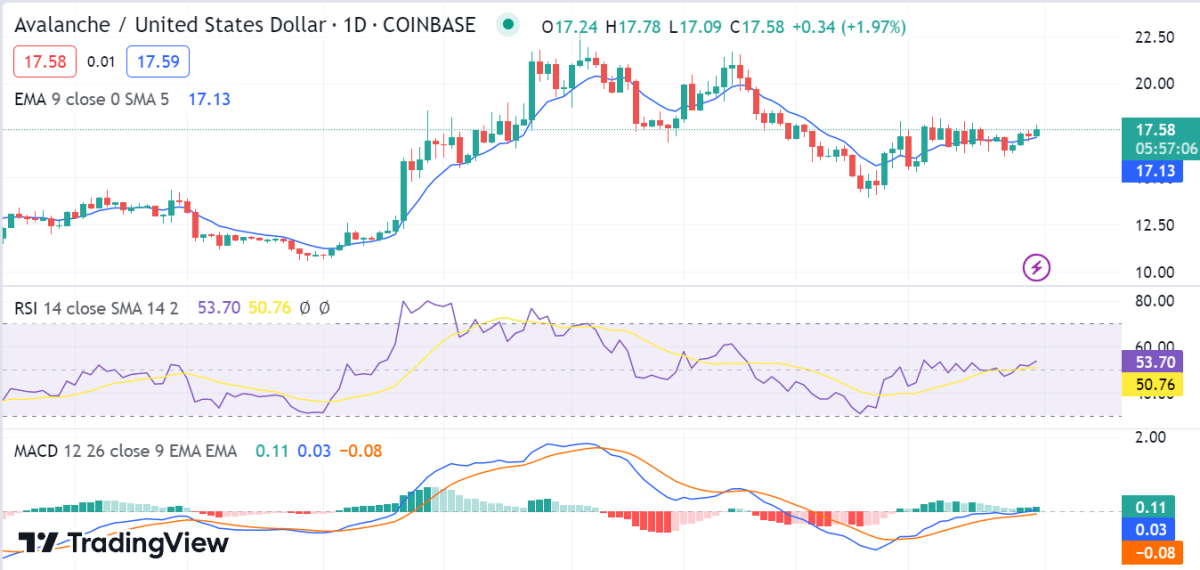
The Moving Average Convergence Divergence indicator shows a change in momentum to the bull’s side as the signal line (red) is now below the MACD line (blue). Moreover, the 10-day exponential moving average (EMA) has crossed above the 50-day EMA, indicating that the bulls are in control of the market momentum. The Relative Strength Index is currently at 53.70, which indicates that the UNI/USD may see a slight correction before it can resume its upward trend.
AVAX/USD 4-hour price chart: Bulls resume action after overcoming the 17.58 hurdle
Looking at the 4-hour Avalanche analysis reveals that the cryptocurrency has been following an uptrend for the last 4- hours. The bears have been trying to push the price below the $17.12 support, but they have been unsuccessful so far. The bulls need to break the $17.76 resistance to resume the uptrend and target the $17.58 level. The AVAX/USD pair has reached a 24-hour trading volume of $194 million and the market cap is currently at $5.7 billion.

The 50 EMA and 10 EMA are both currently providing support for the price. On the other hand, the moving average convergence and divergence (MACD) indicator shows that the price is currently trading over the histogram, which proves a strong bullish sentiment. The MACD line (blue) is currently above the signal line (red). The Relative Strength Index (RSI) is currently at 61.84, which indicates that the market is in a bullish zone.
Avalanche price analysis conclusion
In conclusion, Avalanche price analysis shows that one-day and four-hour price charts predict an increasing trend for the day as the coin value heightened up to $17.58. The bears were dominating, but now the bulls seem to be taking control of the price trends. The market shows constantly increasing characteristics, which means the bullish movement will continue in the near future.