The Avalanche price analysis is highly bullish for today as the coin rallied from $11.58 to $11.77. The bulls took the lead following a descending for the previous day, but overall the cryptocurrency price is in the higher price range as the next resistance stands at $11.77, and the support for AVAX/USD stands at $11.58. A rise in price has been observed in the last 24 hours as well, which is quite encouraging for the buyers.
The price has been uplifted to the $11.77 level, as the bulls have been successfully maintaining the upwards trend line since the start of today. The market capitalization of the coin has also reached $3.67 billion, while the 24-hour trading volume of the coin is currently at $104 million.
AVAX/USD 1-day price chart: Avalanche gains 0.73 percent as trading volume increases significantly
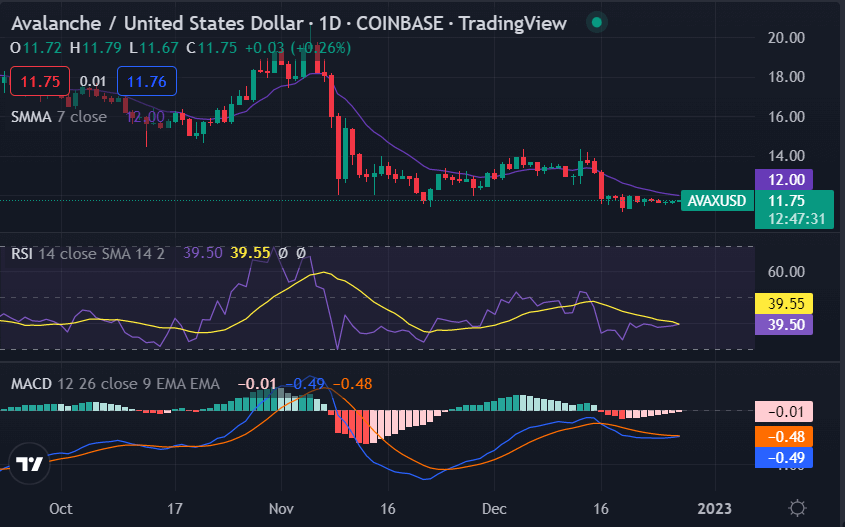
The 1-day Avalanche price analysis shows the price has increased significantly today as the bulls regained control. AVAX/USD is trading at $11.77 at the time of writing as the AVAX reports an increase in value of 0.73 percent over the last 24 hours as bulls showed good momentum today. However, AVAX also reports a 1.55 percent decrease in value over the past week, which is also a considerable loss.

The MACD indicator shows bullish movement as it moves above the signal line. The RSI indicator is also in the overbought zone, indicating that AVAX may see a minor correction soon. However, overall the trend remains upward for now. The SMA lines are also showing a bullish crossover, indicating a positive trend in the near term.
AVAX/USD 4-hour price chart: Bulls struggle to make a breakthrough above $11.77
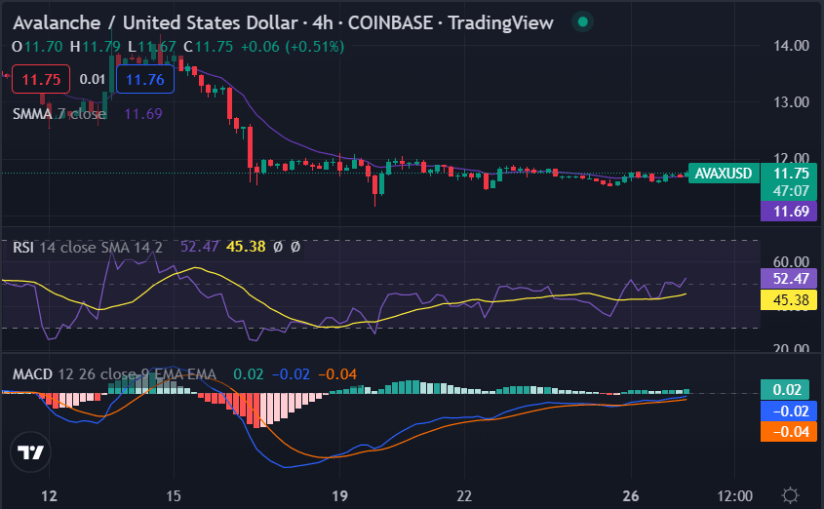
The 4-hour Avalanche price analysis shows the price is struggling to make a breakthrough above the $11.77 level, as the bulls are yet to gain enough momentum. However, overall the recent trend line on the 4-hour chart has been upward for the last 24 hours as the coin started to rally during the last trading session.

The Histogram is also in the positive zone, indicating that the bulls have managed to take control of the market. The MACD indicator is also in the bullish territory as it moves above the signal line. The RSI indicator is also in the overbought zone, indicating that AVAX may see a minor correction soon.
The SMA 50 is also trading above the SMA 200 line, indicating a bullish trend in the near term. Overall, it looks like AVAX is bouncing back after a few days of losses and could be headed for more gains in the coming days.
Avalanche price analysis conclusion
Overall, Avalanche analysis shows that the coin is currently experiencing bullish momentum and may continue to rise in price if it breaks through resistance levels. However, investors should also keep an eye out for any potential correction in the near term.


