According to the Avalanche price analysis, the bears are currently controlling the market. The price has been falling since 19 November 2022, and the trend line is downward as a result of the bears’ success in keeping control of the market. As the coin continues to experience negative market sentiment, a decline has been seen today as well, with the price dropping to the $11.76 mark. It is also anticipated that the price function would continue to be bearish in the hours to come.
AVAX/USD 1-day price chart: Bears still dominating the market
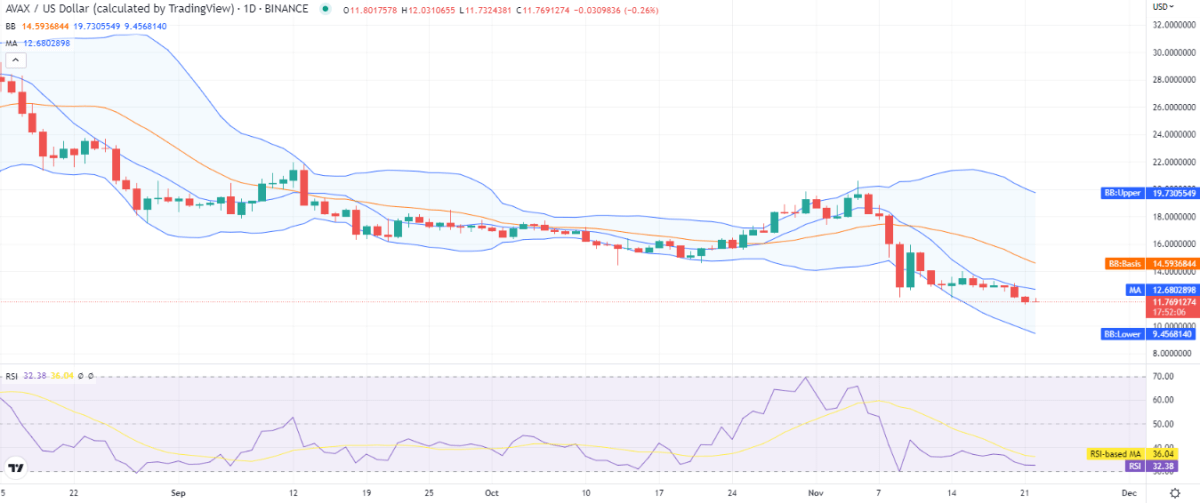
As the price has dropped up to the $11.76 level, the 1-day Avalanche price analysis report suggests a bearish price movement for today. The coin’s price dropped by a negligible 2.12% during the past day, but the bears have been in control lately, and the cryptocurrency has suffered a significantly greater loss of 10.18% over the past week. For the previous few weeks, the price has been falling with occasional bullish breaks. After gaining momentum, the bears were able to drive the price back down in the last 24 hours. Additionally, the price has been trading below the $12.68 moving average (MA) figure.

The diverging Bollinger bands indicate that the volatility is rising, indicating that the cryptocurrency is still extremely volatile. The strongest resistance is now represented by the upper Bollinger band value of $19.7, while the lowest Bollinger band value of $9.45 represents support for the coin. The Relative Strength Index (RSI) score has decreased once more as a result of stepping close to the underbought region at index 32 and a downward-sloping curve that suggests market selling activity.
Avalanche price analysis: Recent developments and further technical indications
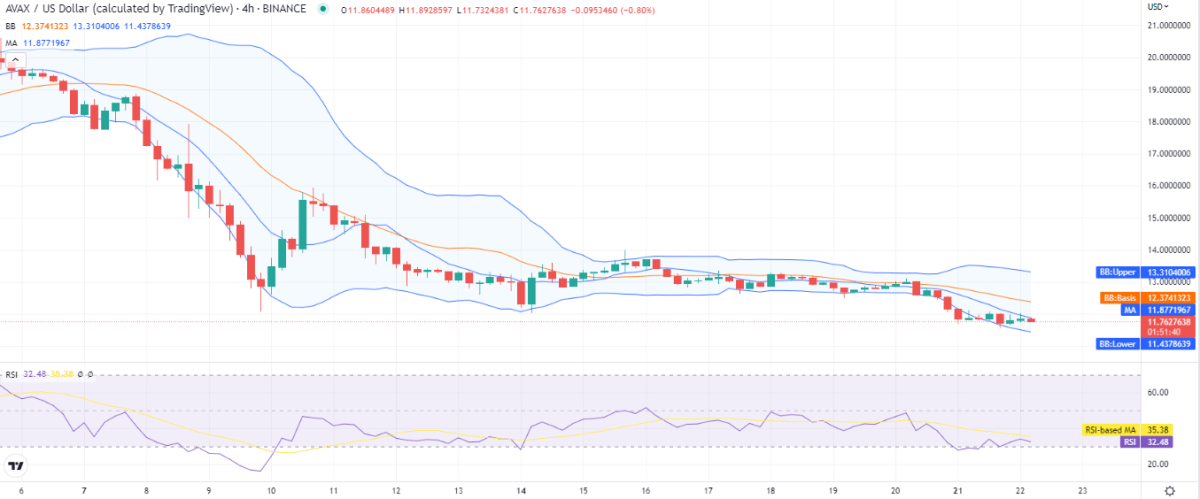
The price has been covering a downward range over the past several hours, but today’s breakout was in an upward direction, as seen by the 4-hours Avalanche price analysis, which further demonstrates the bears’ dominance. The price dropped to the $11.76 mark in recent hours as the bears made a comeback, indicating a bearish trend. As the bears gather momentum, the price has fallen sharply. The moving average is trading above the price level at $11.87 on the 4-hour price chart.

The Bollinger bands show divergence on the 4-hour chart, and the increase in volatility has changed the upper band’s value to $13.3, and the lower band’s value has come down to $11.43. The RSI level has decreased to 32 because of the selling activity observed since yesterday.
Avalanche price analysis conclusion
The Avalanche price analysis is in favor of the bearish side at the time of writing. Most of the technical indications are also bearish, and the price momentum is downward right now. The RSI curve has also moved near the undersold zone again. Today’s trend seems completely bearish, and a further decrease in the coin’s price levels is also expected in the coming hours. However, the downfall is still controllable, and bullish efforts may also emerge to provide support to the cryptocurrency’s price.
Disclaimer. The information provided is not trading advice. Cryptopolitan.com holds no liability for any investments made based on the information provided on this page. We strongly recommend independent research and/or consultation with a qualified professional before making any investment decisions.


