Given that the cryptocurrency has encountered bearish resistance from the start of the trading session, the most recent Avalanche price analysis suggests a lower trend for the market. Even though the scenario in the previous week benefited buyers, there is still bearish pressure. The coin value is currently at $13.36 and could decrease considerably more if the selling pressure picks up again.
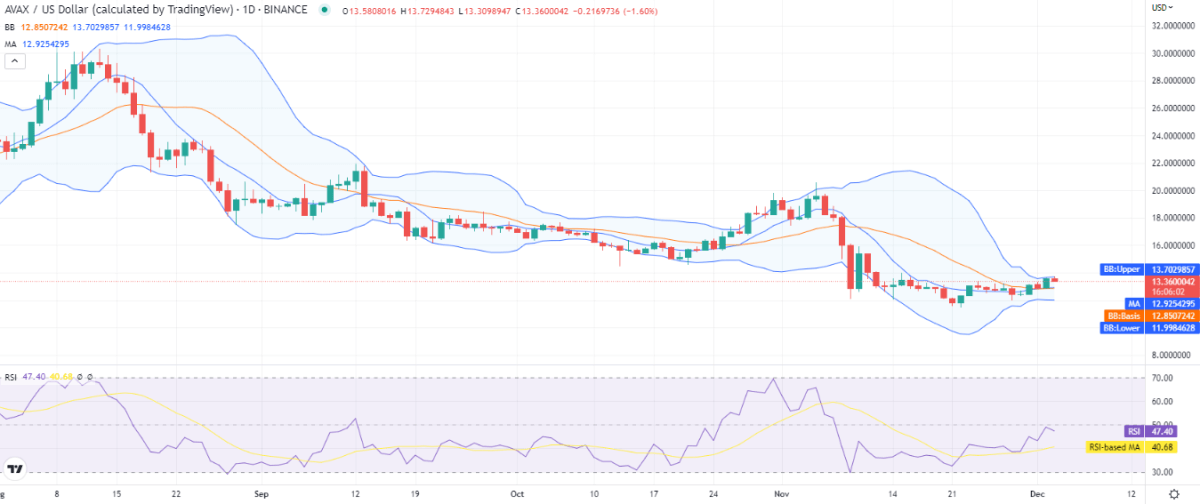
AVAX/USD 1-day price chart: Selling pressure results in a price drop up to $13.36
The daily Avalanche price analysis places the bears in the lead because there has been more selling today. Despite the market having been dominated by a bullish wave the previous week, today’s trend appeared to be largely in favour of the sellers. Due to the downward trend, the market value of AVAX/USD has decreased up to $13.36. The price is still greater than the $12.92 value of the moving average (MA).

Due to the convergence of the Bollinger bands, the volatility is on the lower side, which is a pretty unfavourable sign for future market developments. The Bollinger bands indicator’s upper value currently stands at $13.70 and represents resistance, while its lower value is $11.99 and represents support. The most recent price decline has caused the Relative Strength Index (RSI) score to drop to index 47.
Avalanche price analysis: Downslide devalues AVAX/USD till $79.99 extreme
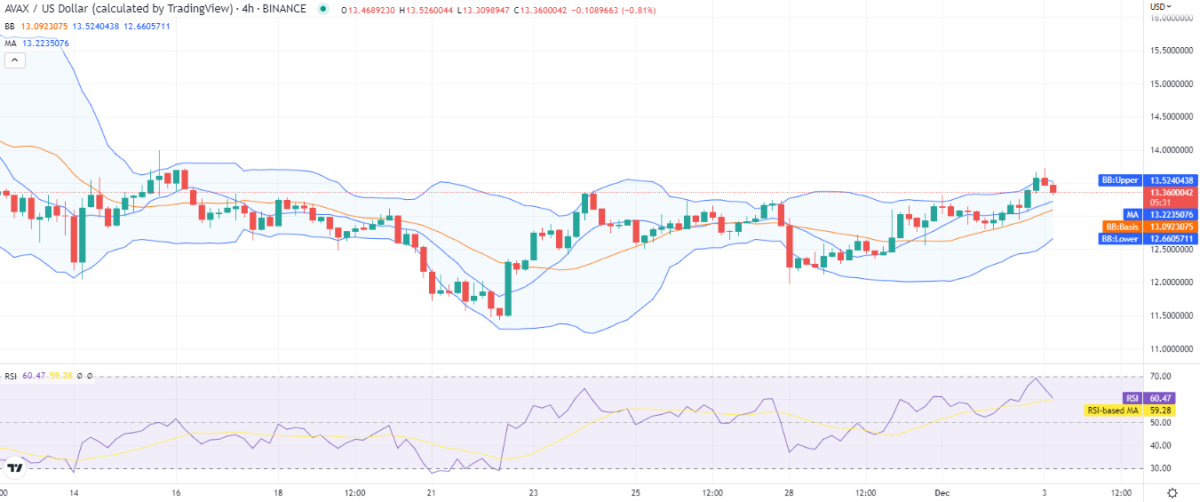
Given that the coin value has decreased significantly over the last eight hours, the four-hour Avalanche price analysis reveals a strong negative trend. For the previous few hours, the bears have been outperforming the bulls by scoring a string of victories. The selling activity has recently increased due to the coin’s decreased value of $13.36. The likelihood of more cryptocurrency value declines appears to be rather high. Additionally, the hourly price chart’s moving average value is $13.22 points.

The volatility is mild, and the Bollinger bands are moving upward due to the previous bullish wave, which means that the downtrend might reverse in the next trading session. At the same time, the upper Bollinger band is now resting at $13.52 high, while the lower Bollinger band is present at $12.66 low. The RSI graph shows a downward curve, and the score has moved down to index 60. The downward curve is hinting at the selling activity taking place in the market.
Avalanche price analysis conclusion
Given that there has been a decrease over the last 24 hours, the one-day and four-hour Avalanche price analysis is favoring sellers. Due to the most recent price decline, the coin is now worth $13.36. The hourly price chart likewise exhibits a steady decline in price levels, and for today, we anticipate AVAX/USD to continue in this downward pattern.
Disclaimer. The information provided is not trading advice. Cryptopolitan.com holds no liability for any investments made based on the information provided on this page. We strongly recommend independent research and/or consultation with a qualified professional before making any investment decisions.


