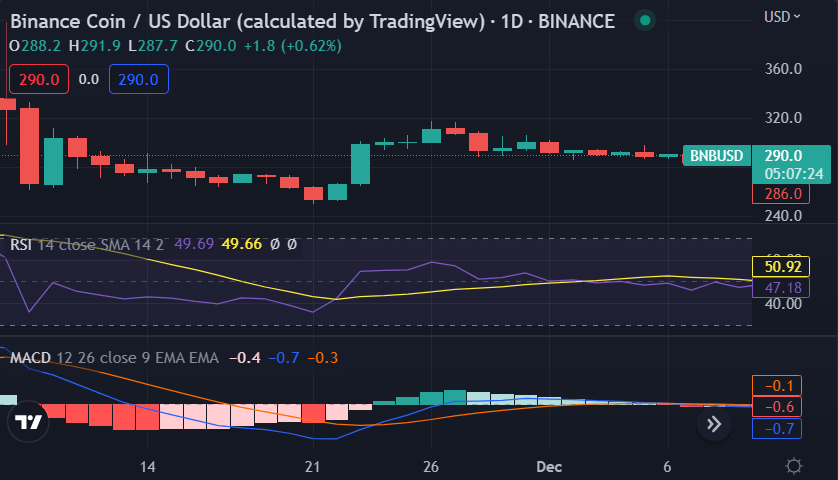
Binance coin price analysis reveals BNB coin has traded in a narrow range of $287.84 and $290.83 in the past 24 hours, which is a positive sign for the coin. The trade volume has been low at $57,977,649,621 in the same period, indicating consolidation is taking place rather than buyers losing interest. Binance Coin is trading at $289.94 and has increased by 0.60 percent in the last 24 hours.
Binance Coin price action in the last 24 hours: Bulls maintain control
Binance Coin price analysis reveals the BNB coin has held above the current trading values for quite some time. The lower end of the range is at $287.84, while the upper end is at $290.83. The coin has traded in this range with a few minor slippages as well. Since the start of trading today, BNB has remained firmly within this range and closed higher by 0.60 percent.

The bulls have maintained the upper hand in this market for quite some time and it would be interesting to see if they are able to break above the resistance level at $290.83, or if there is a pullback from this point. For now, the coin is showing a bullish bias with an increase in volume. This has signaled a short-term uptrend, but it might find resistance at $292.30 and $293.56.
The stochastic is still in the overbought zone, which suggests a pullback may be imminent. The next support levels are at$288.56 and $285.70, while the immediate resistance levels are at $290.83 and $293.56.
The Relative Strength Index is at 69.657, which indicates that Binance Coin is neither oversold nor overbought. The MACD lines are sloping upwards, but the histogram has flattened out and has yet to cross above the zero line.
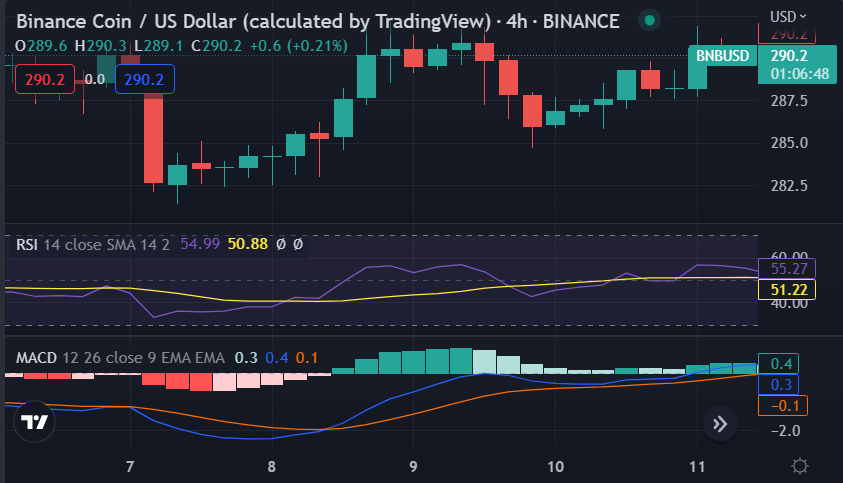
Binance Coin price analysis on a 4-hour chart: BNB trades in a range-bound channel
Binance Coin has been trading in a range-bound channel in the last few days. This is indicated by Bollinger Bands, which are moving closer together and forming converging levels. The price of the coin may break out of this triangle formation at any time since it has been tested on so many occasions from both sides of the upper and lower trend lines.

The immediate support levels are at $288.56 and $285.70, while the break-out price is estimated to be around $293.65 and upside resistance levels are placed at $290.83 and $292.30.
The 50 MA line is about to cross above the 100 MA line, which is a positive sign that the bulls may regain control of this market soon. The 200 EMA line is below the current price level and indicates a strong bearish trend, while RSI levels are at 60.632, which suggests a consolidation period in the short term.
Binance Coin price analysis conclusion
Binance Coin price analysis shows the coin has been trading with a bullish bias over the last four hours. The MACD lines are about to cross above the zero line, which suggests a potential breakout. However, the stochastic levels and RSI have both entered overbought zones and suggest a slight pullback from the current trading values. The support levels at $288.56 and $285.70 are likely to be tested in the near future.


