The Binance coin price analysis is bullish for today as the cryptocurrency is in bullish form, and bulls have successfully outperformed the bearish momentum, as the bulls are trying to recover once again. The bulls are planning to breach past the $251 resistance as the price has already reached $249. The recent uptrend has been quite encouraging during the past week, and the trend line orientation was downwards; however, the cryptocurrency has been rebounding from the bearish pressure since 17 December, 2022. A further increase in price value is anticipated as the bullish trend continues to build.
BNB/USD 1-day price chart: BNB shows a bullish tendency as the price rallies toward $251
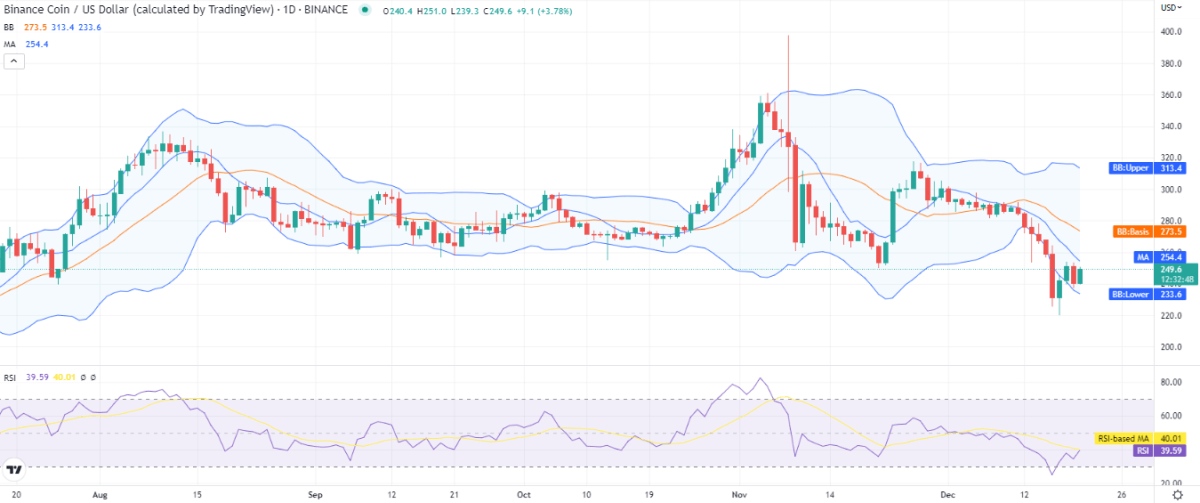
Since there has been a sizable growth in the price value, the one-day Binance coin price analysis is going well for the cryptocurrency. The price is moving up and looking for a higher level as it approaches the barrier that is currently at a level of $251. The price has now increased to $249, rising by 7.21 percent over the previous week and 0.53 percent over the previous 24 hours.

The moving average (MA) for the 1-day chart is at $254 as there has been bullish activity during the current week as well, but the SMA 20 is still trading below the SMA 50. At the same time, the Bollinger bands are making an average of $273 in the 1-day BNB/USD price chart.
The Bollinger bands are showing high volatility for the BNB price function as its upper and lower values are situated at the following marks; the upper limit is at $313, representing the resistance, whereas the lower limit is at $233, representing the support, also indicating the volatility has been towards the higher side for the day. The Relative Strength Index (RSI) score is 39, and the indicator is in the upwards direction in the neutral zone.
Binance coin price analysis: Recent developments and further technical indications
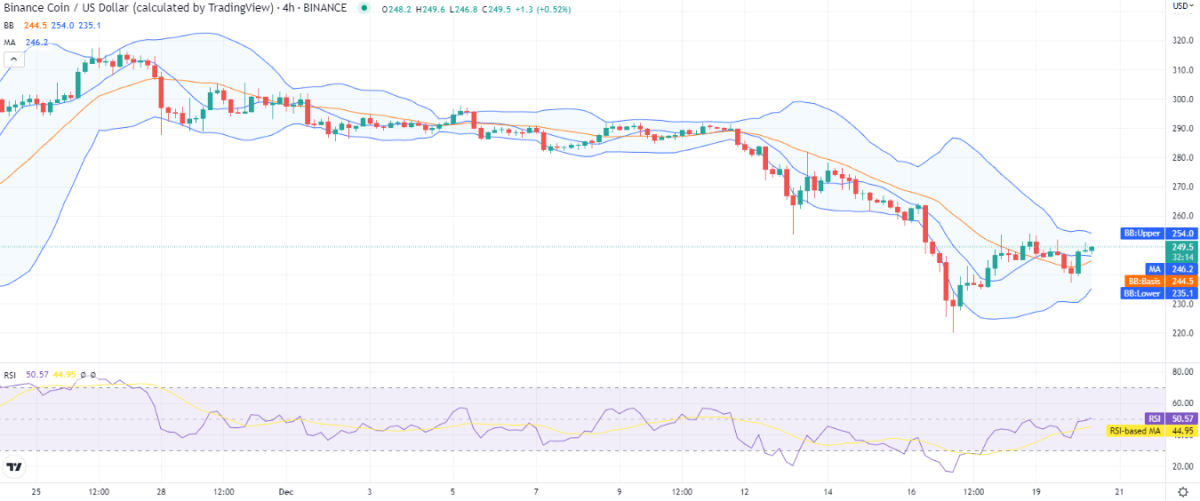
The price is rising again, as can be seen on the 4-hour Binance coin price analysis chart, as the bulls have regained their impetus in recent hours. The current BNB/USD exchange rate is $249, and it is anticipated that it may rise much more in the ensuing hours. The price is getting close to the first local resistance around $251, therefore the price fluctuations have slowed down over the past eight hours.

The moving average is at the $246 level for the 4-hour price chart as the bulls have gained the advantage of the situation as they have been able to reverse the continuous bearish trend in the past couple of days. The Bollinger bands indicator shows the following values; the upper value is $254, and the lower value is $235, hinting at the scope for price fluctuations. The RSI score has also undergone improvement because of the recent uptrend and has reached the index of 50 as it moves upwards in the upper half of the neutral region.
Binance coin price analysis conclusion
According to the Binance coin price research, the trend for BNB/USD has been bullish for the day as bulls look to recoup following a protracted losing streak. The cryptocurrency has performed well today, as the price has successfully surpassed $249 and has levelled out once more. The positive trend is anticipated to pick up in the ensuing hours, and we anticipate BNB to once more break through the $251 local resistance.


