Bitcoin’s active address ratio has hit a historic low, plunging to levels unseen since November 2010. According to onchain data, the weekly active wallet ratio in June dropped to a mere 1.22%, peaking at just 1.32% during the month.
The last time we saw such numbers was over a decade ago.

This decline in active addresses signifies a reduction in buying and selling activities among Bitcoin holders. The total number of active wallets has also hit multiyear lows.
For the week of May 27, there were only 614,770 active wallets, marking the lowest count since December 2018. This trend hints at a consolidation, with less frequent transactions among Bitcoin users.
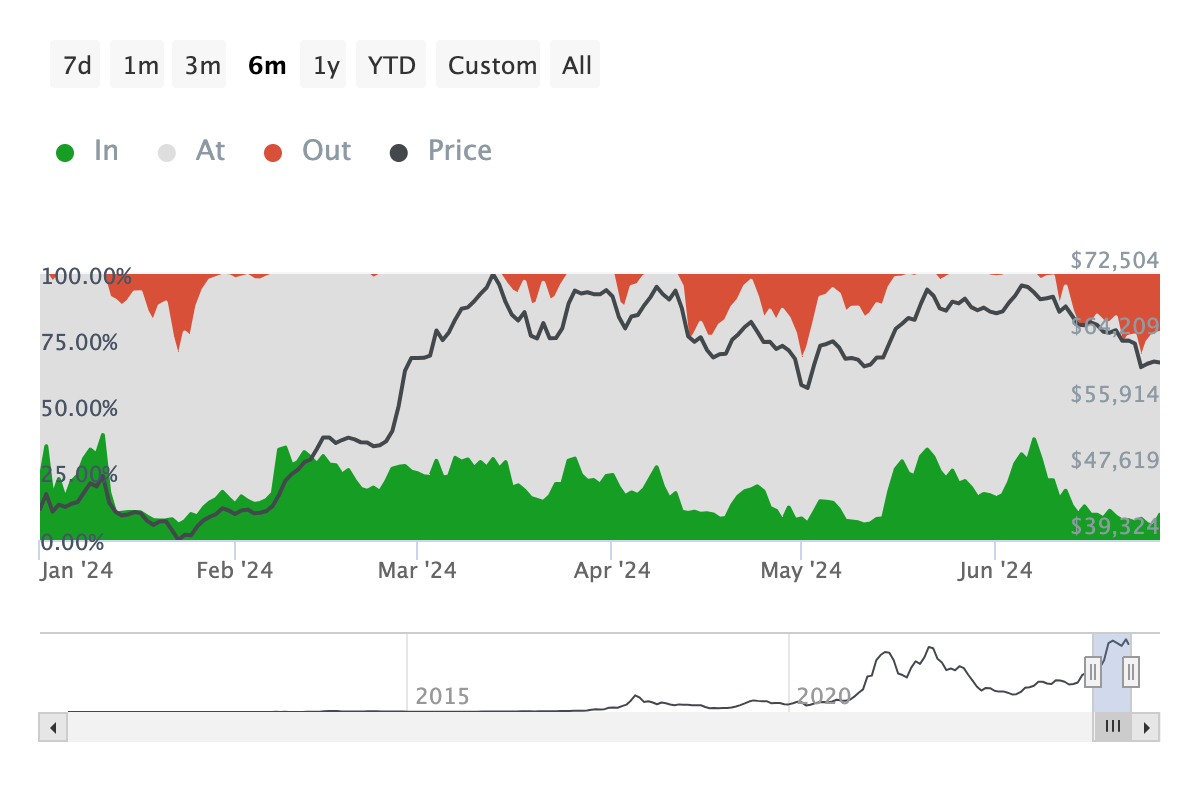
Looking closely at Bitcoin’s token summary, we see that 85% of Bitcoin holders are currently making money at the prevailing price.

This high profitability rate could deter new buyers who might see less potential for upside unless they believe in long-term growth.
Next, the concentration by large holders stands at 12%. This relatively low percentage indicates decentralized ownership, which reduces the risk of price manipulation by a few big players.
Moreover, 70% of Bitcoin holders have held their assets for over a year. This high percentage of long-term holders indicates strong confidence in Bitcoin’s future.
However, the presence of 25% medium-term and 5% short-term holders suggests there is still some liquidity and recent buying activity.

84.57% of Bitcoin addresses are ‘in the money’ at the current price, which suggests that the price has generally been rising or stable since these addresses acquired their holdings.
However, those ‘out of the money’ could be under pressure to sell if the price drops further, potentially increasing market volatility.
If these holders start to panic sell, it could lead to a downward spiral in Bitcoin’s price.
The bulls and the bears are in a standoff
The bulls and bears sentiment index provides another perspective. Over time, the sentiment has been more bullish than bearish, but the gap has narrowed recently. This narrowing gap suggests growing caution or even pessimism among traders.

This shift in sentiment could be related to the low active address ratio, indicating a lack of user engagement or new investment in Bitcoin.
The NVT ratio, which compares Bitcoin’s network value to transaction volume, also shows volatility and a general downtrend in usage relative to the network’s valuation.
This decreasing NVT ratio, coupled with a downward-trending price line, means that the current price levels are not sustainably supported by actual transactional usage.
![]()
Moreover, the bearish sentiment gaining traction and the fluctuating NVT ratio indicate potential short-term price volatility or a corrective phase.
Technical indicators side with the bulls
Let’s dive into a technical analysis of BTC/USD using a 30-minute candlestick chart, paired with Ichimoku Cloud and Relative Strength Index (RSI) Divergence indicators.
The Ichimoku Cloud is made of several lines and the ‘cloud’ formed between the Span A and Span B lines. Currently, Bitcoin’s price is trading slightly above the cloud, a typically bullish signal suggesting that the trend is upwards.
This price consolidation above the cloud suggests uncertainty, with traders likely waiting for a more definitive signal before committing to larger positions.

The RSI line is in the lower section of the graph, showcasing the momentum of price movements. An RSI value hovering around 10 indicates major divergence, with momentum being relatively high compared to the average.
This could potentially signal a strengthening bullish trend if the RSI moves back above the mid-line (50 level), indicating growing buying pressure.
All in all, the short-term outlook could lean slightly bullish, provided the price remains above the cloud.
Reporting and analysis by Jai Hamid


