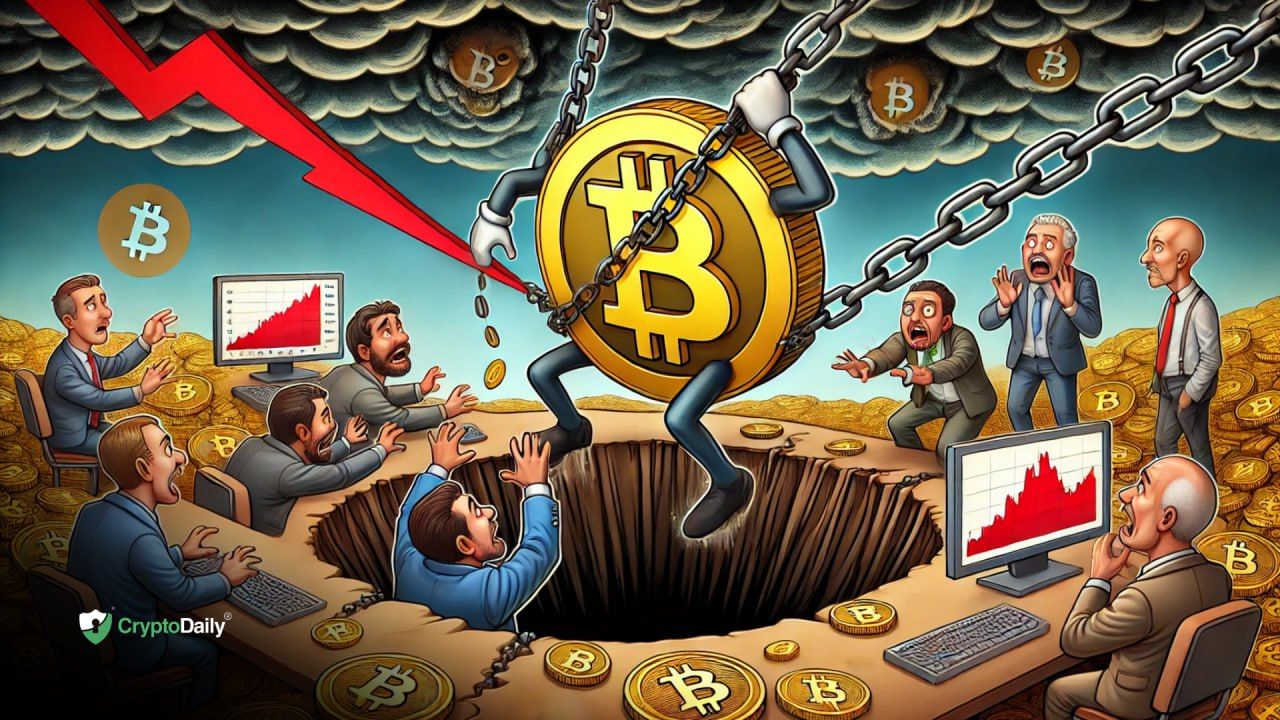
Nerves are jangling once again among Bitcoin investors as $BTC plummets $4,200 over the last 3 days. Price is holding above $60,000 currently. Can this continue to hold? Will there be one more flush out before $BTC heads higher again?
Bitcoin investors given quite a ride
The unrelenting shocks to the Bitcoin price are very likely shaking out any weaker hands that were still clinging desperately to their positions. Very much like a bucking bronco, Bitcoin is taking investors through the full gamut of their emotions.
Source: Alternative.me
The Fear and Greed Index has switched back into Fear, losing 10 points from its indication of a Neutral 49 only yesterday.
One more sweep below $60,000?
The dip may not be over yet. There are still some pockets of liquidity below $60,000, and market makers may want to sweep these first before potentially allowing the price to rise again. This liquidity stretches down to around $59,300. That said, on the other side of the coin, a lot more value in liquidations could take place from $61,000 through to $63,000.
A couple of days of net outflows from the U.S. Spot Bitcoin ETFs add to the misery of the bulls, although these outflows were relatively small, resulting in 299 BTC on Tuesday, and 492 BTC on Wednesday.
$BTC breakout in next few days
Source: TradingView
The daily chart for $BTC shows the price just above the middle of the bull flag. The price is currently inside a triangle and is heading to a breakout decision in the next few days. For this particular reversal phase, the $BTC price may have now found a bottom, having come down just below the 0.786 Fibonacci, and having touched the bottom trend line of the triangle.
The price might be expected to rise from here, given that the short time frame Stochastic RSIs are bottoming, ready to turn back up and provide momentum to the upside.
Weekly Stochastic RSI displays perilous possibility
Source: TradingView
The weekly chart displays a clear picture. The $BTC price is currently holding exactly above the very strong horizontal support at $61,000. However, it’s at the bottom of the chart where the most telling action is taking place. The weekly Stochastic RSI is showing that a cross-down of the indicators is potentially about to happen. If this is confirmed at the end of this week, it would be very bad news for the Bitcoin bulls, given that it would signal strong downside price momentum going forward.
The bulls have the next few days to turn these indicator lines back around. Their success, or lack of, could decide Bitcoin’s price direction for the next few weeks.
Disclaimer: This article is provided for informational purposes only. It is not offered or intended to be used as legal, tax, investment, financial, or other advice.