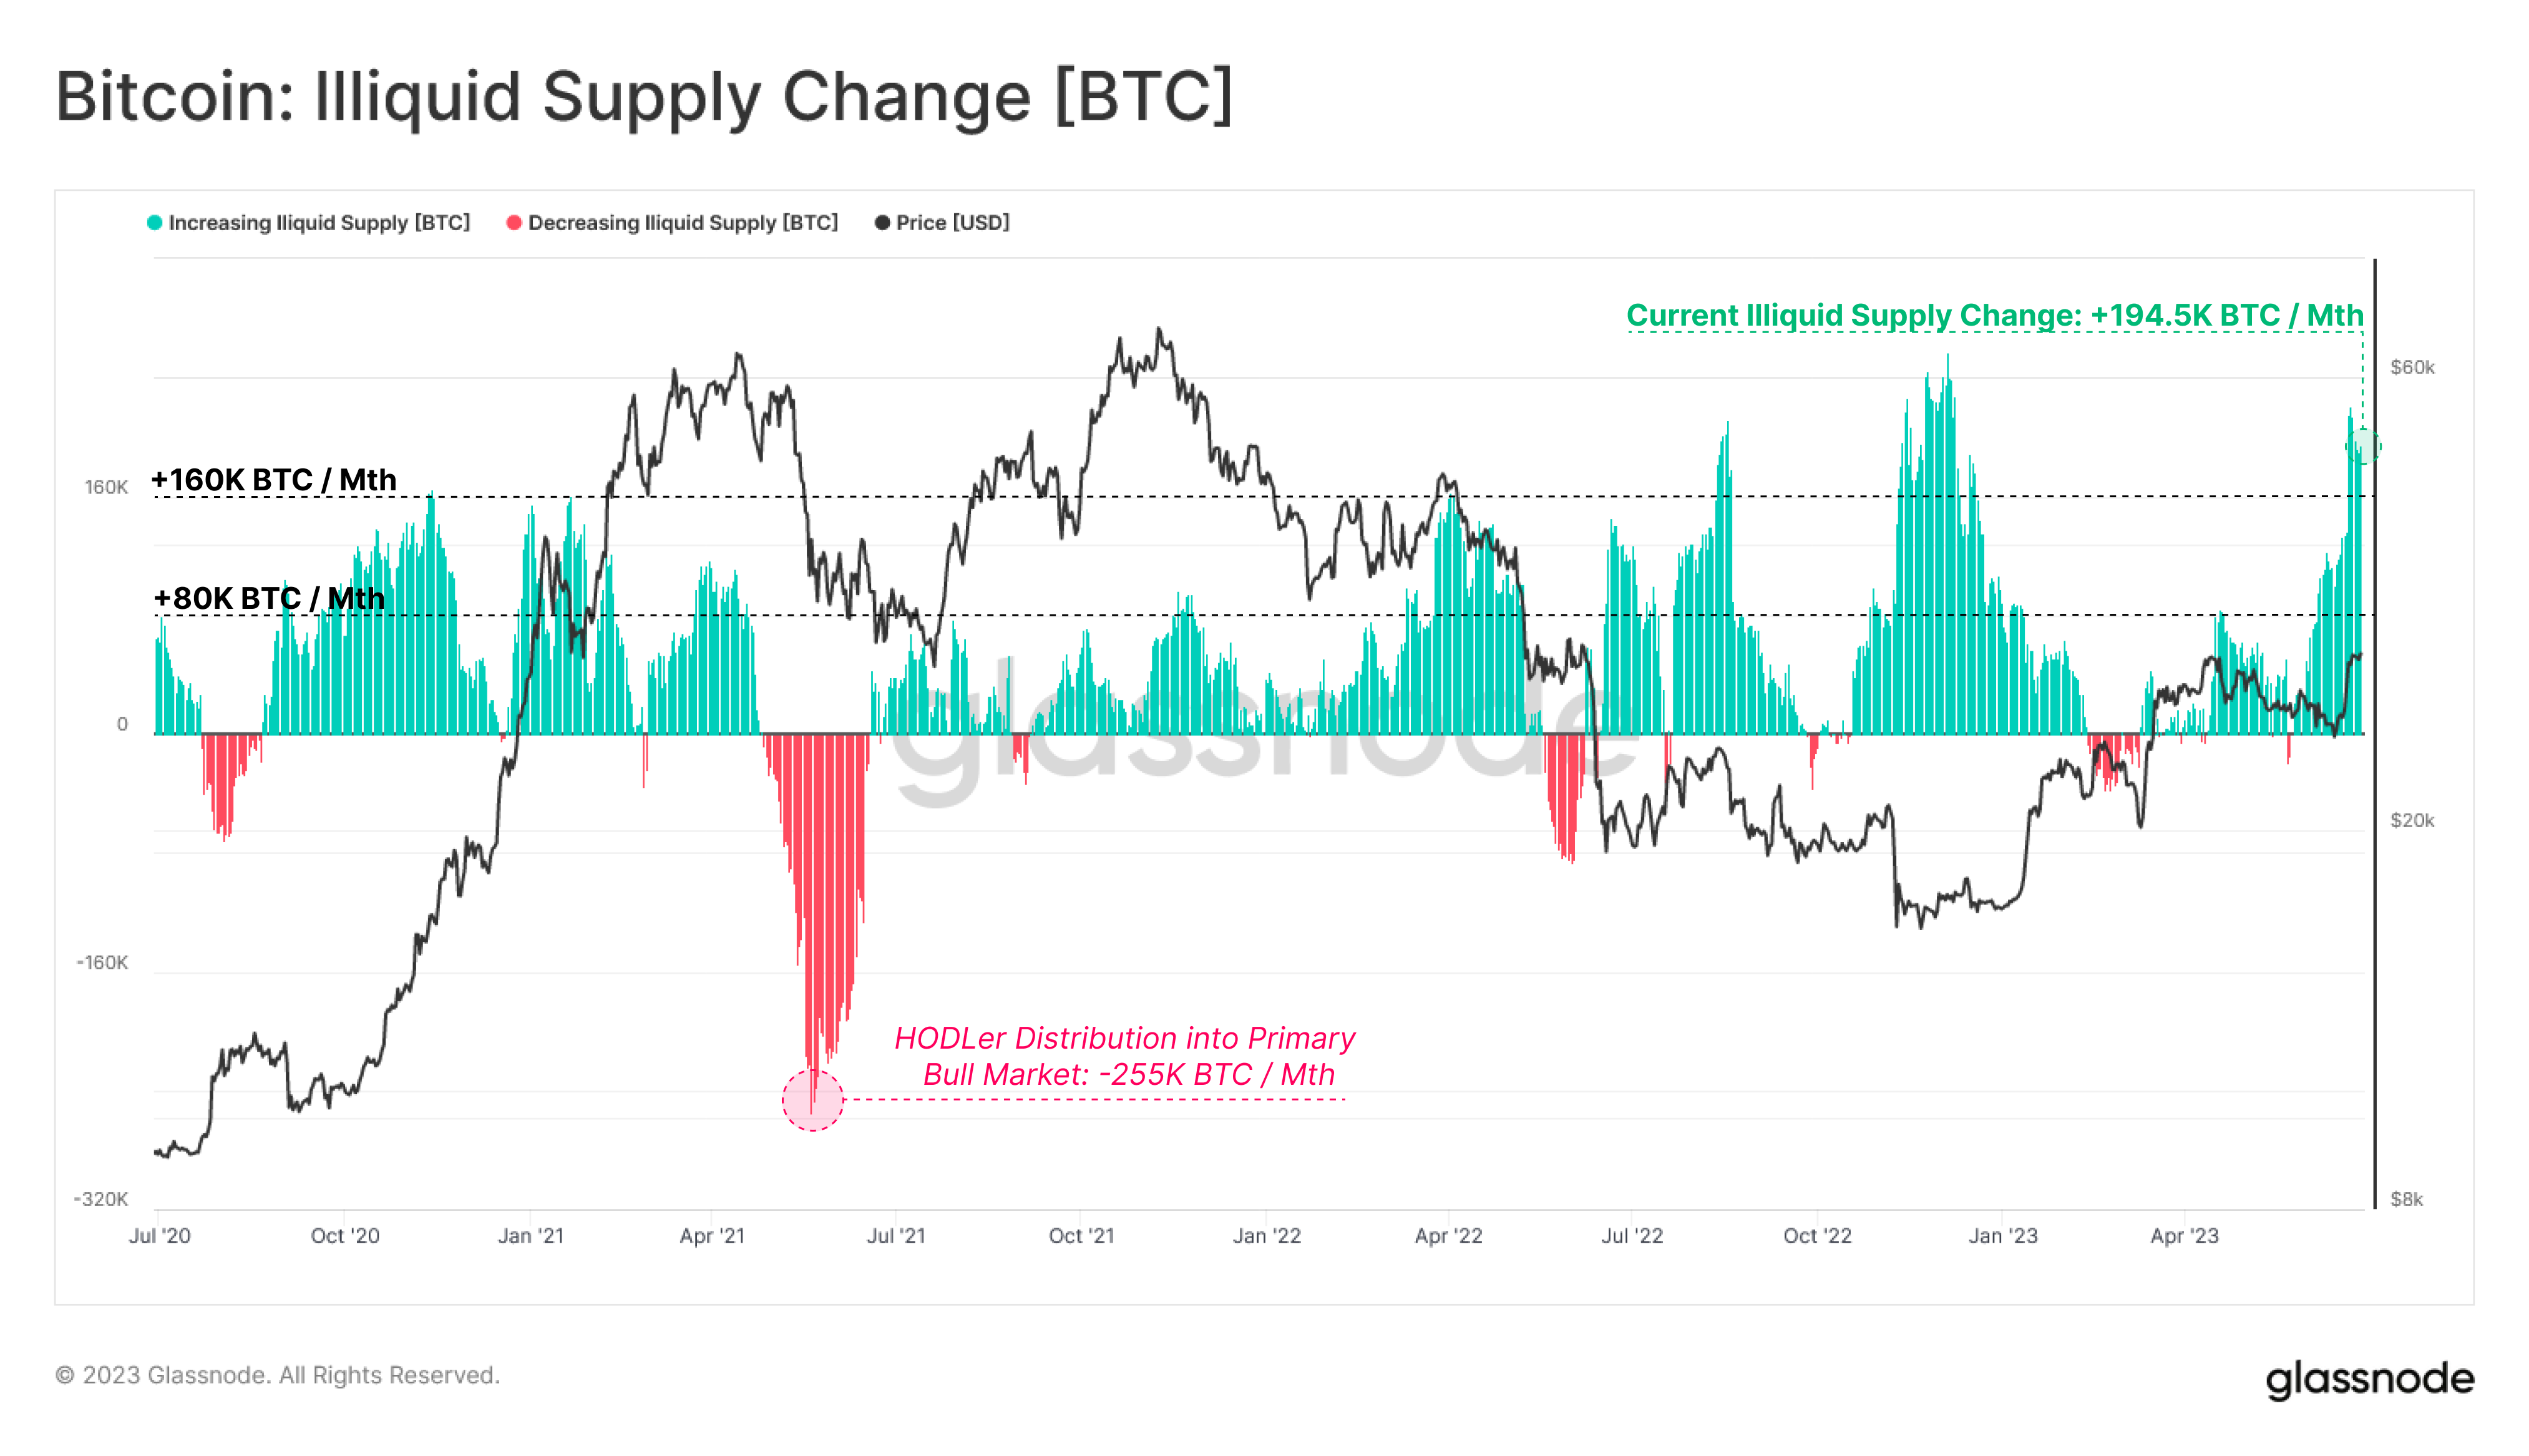
On-chain data shows the Bitcoin HODLers have continued to accumulate recently as they expand their holdings at a rate of 194,500 BTC per month.
Bitcoin’s Illiquid Supply Has Continued To Go Up Recently
According to data from the on-chain analytics firm Glassnode, the BTC illiquid supply is currently growing at rates near the cycle high. The “illiquid supply” here refers to the combined wallet amounts held by Bitcoin entities that have little to no history of spending their coins.
An “entity” here is a single address or a collection of addresses that Glassnode has determined through its analysis to belong to the same investor. The entities that have participated in a low amount of selling would be the high-conviction BTC investors, popularly called the “HODLers.”
The supply of these HODLers may also be tracked using the “long-term holder (LTH) supply” metric, where LTHs are investors who purchased their coins more than 155 days ago.
However, the LTH supply indicator can lag behind, as only coins that have aged at least 155 days ago are included in it. So, if some investors who are planning to hold for extended periods do some buying, the LTH supply wouldn’t register them until 155 days later.
The illiquid supply somewhat mitigates this problem as it counts all coins that are likely to mature into the LTH cohort based on their buyers’ past experience. Naturally, this method isn’t entirely accurate, but it can still nonetheless provide us an idea about the buying or selling behavior of the HODLers.
Now, here is a chart that shows the trend in the Bitcoin “illiquid supply change” metric, which measures the 30-day changes taking place in this supply:
As displayed in the above graph, the Bitcoin illiquid supply change has surged to highly positive values recently, implying that the holdings of the investors who are known to HODL for long periods have been expanding.
From the graph, it’s visible that the indicator’s value has actually been positive for a long while now, with the exception of a few brief periods. Back in February-March, for example, these investors had been distributing. Interestingly, the local top in the asset coincided with this selling and BTC then followed up with a sharp decline.
With the recovery rally from this crash, the HODLers went back to accumulating, but their buying remained relatively mild. Recently, however, these investors have ramped up their purchasing, as the illiquid supply change has now neared the cyclical highs that were seen during the consolidation period that preceded the January rally.
According to the current value of the indicator, these investors are buying at a rate of 194,500 BTC per month. While this accumulation may not necessarily provide bullish fuel by itself, the fact that these HODLers have continued to buy through the latest leg in the Bitcoin rally is a positive sign.
BTC Price
At the time of writing, Bitcoin is trading around $30,700, up 2% in the last week.


