A popular crypto analyst is predicting a massive move to the upside for Bitcoin (BTC) if one key indicator continues to follow historical data.
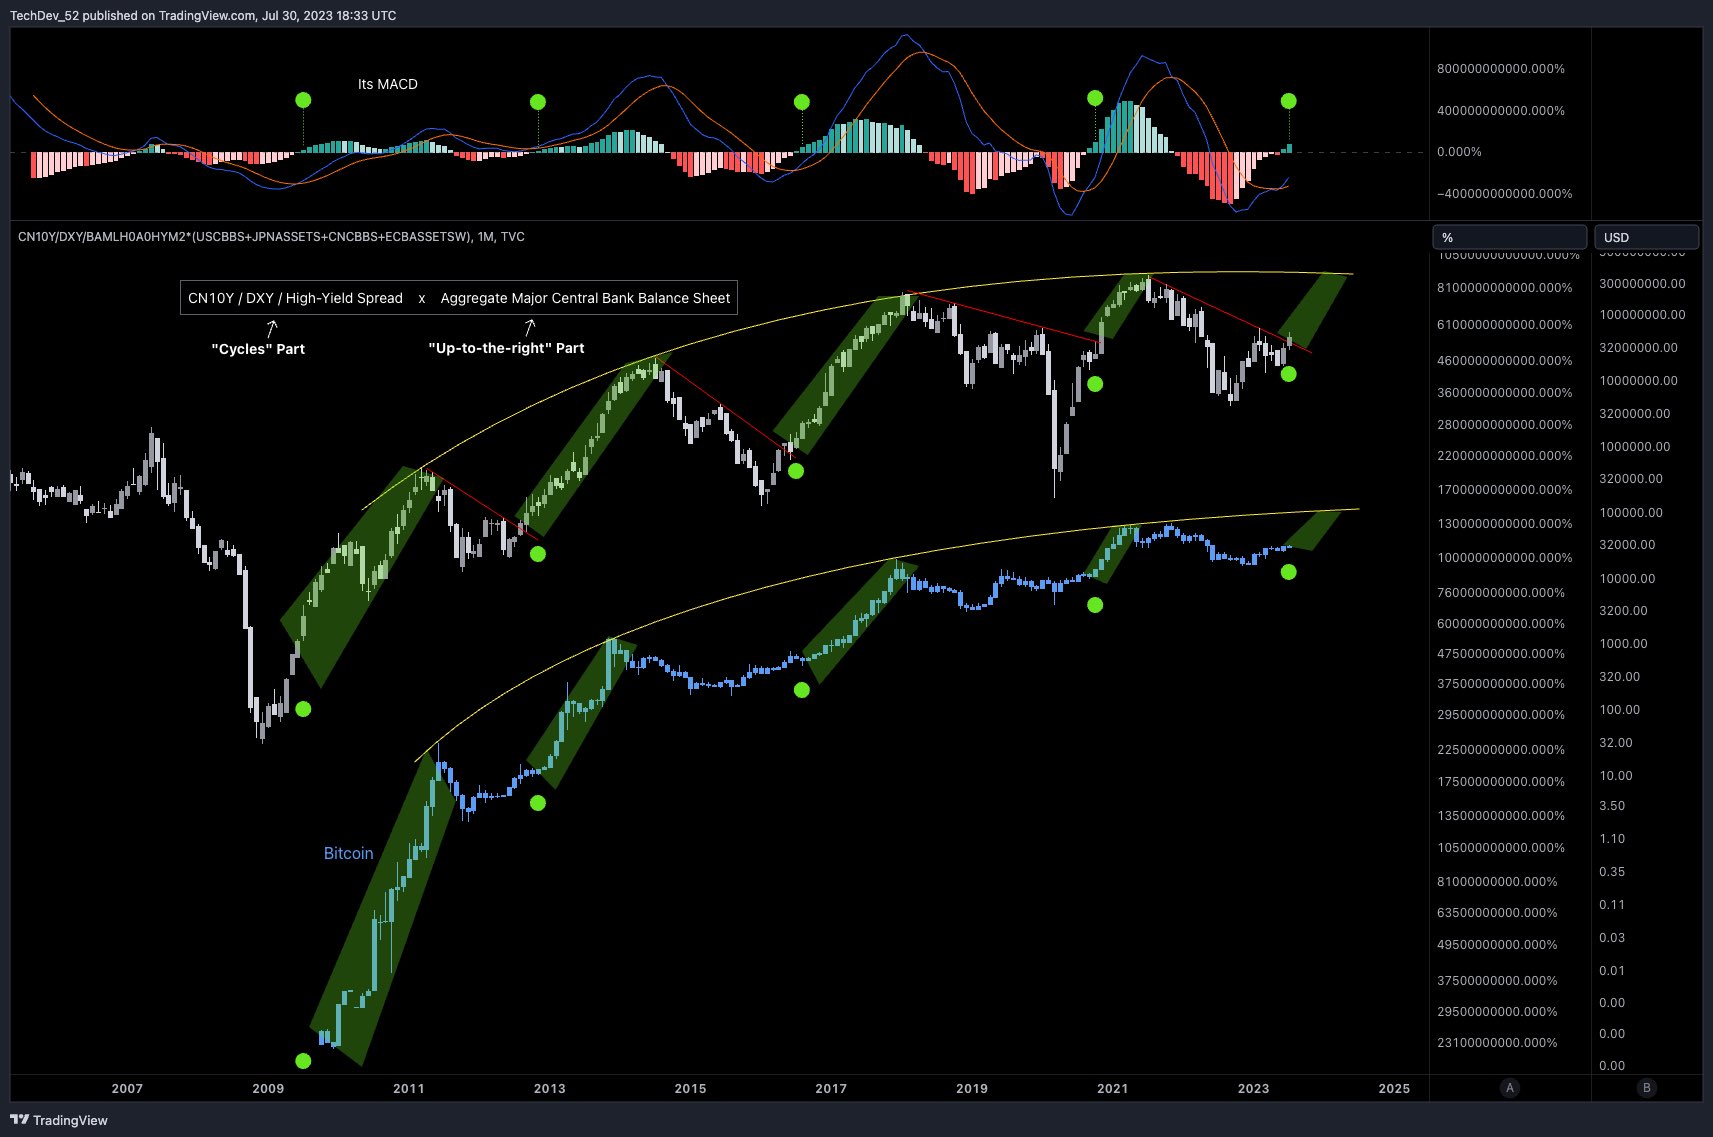
The pseudonymous analyst TechDev tells his 416,400 Twitter followers that he’s keeping a close watch on global liquidity cycles, which he portrays by pitting the Chinese 10-year bonds (CN10Y) against the US dollar index (DXY).
The analyst further elaborates on global liquidity cycles by setting the metric against the aggregate major central bank balance sheet, which tracks the money-printing activities of reserve banks around the world.
According to a chart shared by TechDev, global liquidity appears to be on the verge of an uptrend as major central banks expand their balance sheets. The chart also shows that Bitcoin appears to closely follow in the footsteps of global liquidity, suggesting that BTC will see rapid price acceleration in the months ahead.

If Bitcoin continues on this track, it looks primed to hit TechDev’s logarithmic growth curve (LGC) sometime by or before 2025.
LGCs are designed to estimate Bitcoin’s long-term highs and lows and ignore short-term volatility.
TechDev says the upper bound of the LGC is likely in the $100,000-$140,000 price range.
“But of course that’s a very soft approximation based on the specific LGC curve parameters and impulse steepness.”
With BTC trading at $29,186 at time of writing, hitting $140,000 would represent a nearly 380% price increase.
The top-ranked crypto asset by market cap is down 0.68% in the past 24 hours but up nearly 0.5% in the past seven days. Bitcoin remains nearly 58% down from its all-time high of more than $69,000, which it hit in November 2021.
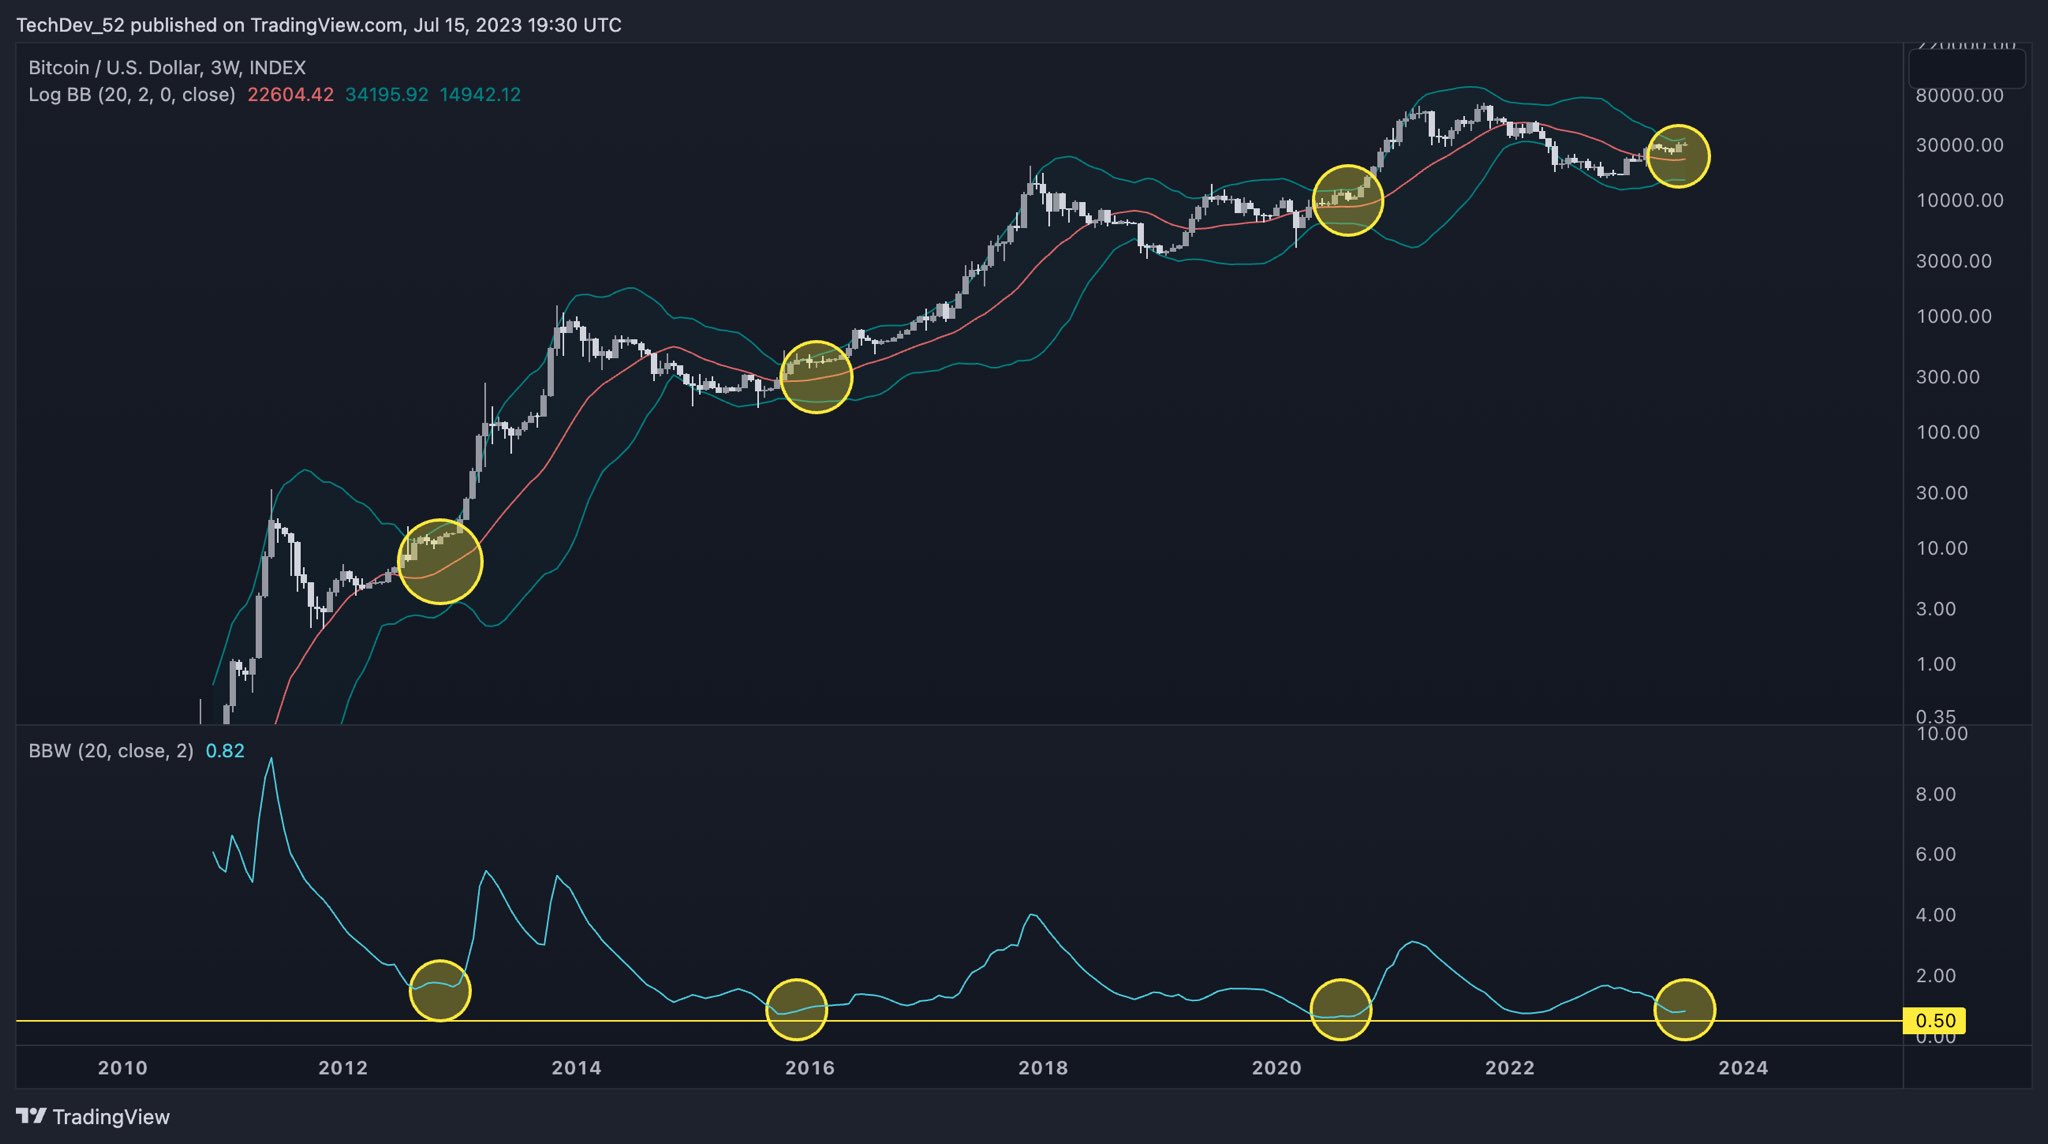
TechDev also notes that the three-week altcoin market cap chart is “at its tightest compression ever,” while Bitcoin’s Bollinger bands width (BBW) hovers slightly above 0.50, which is a relatively low level.
Traders follow the BBW as the metric could signal an explosive move, regardless of the direction, following a period of low volatility,
According to a chart shared by the analyst, a strong BTC uptrend could ensue as the last three times Bitcoin’s BBW came close to 0.50, the crypto king unleashed a full-blown bull market.

Check Price Action
Follow us on Twitter, Facebook and Telegram
Surf The Daily Hodl Mix

Disclaimer: Opinions expressed at The Daily Hodl are not investment advice. Investors should do their due diligence before making any high-risk investments in Bitcoin, cryptocurrency or digital assets. Please be advised that your transfers and trades are at your own risk, and any loses you may incur are your responsibility. The Daily Hodl does not recommend the buying or selling of any cryptocurrencies or digital assets, nor is The Daily Hodl an investment advisor. Please note that The Daily Hodl participates in affiliate marketing.
Generated Image: Midjourney
The post Bitcoin Could Explode 379% if This Indicator Is Correct, According to Crypto Analyst appeared first on The Daily Hodl.


