Bitcoin is on a tear, eyeing the $70,000 mark. So, what’s driving this latest surge? Let’s break it down.
The expiration of over $3.9 billion worth of Bitcoin futures options is a big deal. These options expired early morning on Deribit and set BTC’s “max pain point” at $63,000.
For those unfamiliar, the max pain point is the price at which most options contracts expire worthless. It doesn’t mean Bitcoin will hit $63,000, but it does create downward pressure.

Periods around options expiry are often volatile. Traders brace for price swings, trying to avoid heavy losses. While the max pain point is important, it’s not a guaranteed target.
It’s just one factor in a sea of market influences.
Next up, we have Donald Trump’s upcoming speech at the Bitcoin 2024 conference in Nashville tomorrow. There’s a lot of chatter online about what he might say.
There are expectations of him announcing a Bitcoin Reserve Policy if he wins the next election. The idea of the U.S. becoming a major crypto buyer is enough to get any crypto enthusiast excited.

Alongside Trump’s speech, traders are eagerly awaiting new inflation data from the country.
Recently, the core PCE price index for June was released, showing a 0.2% increase on a monthly basis. This was expected to be 0.1%, with the previous value at 0.10%.
Annually, the core PCE price index was 2.6%, slightly higher than the expected 2.5%. Traders now believe the Federal Reserve will keep rates unchanged in July but might start cutting them in September.
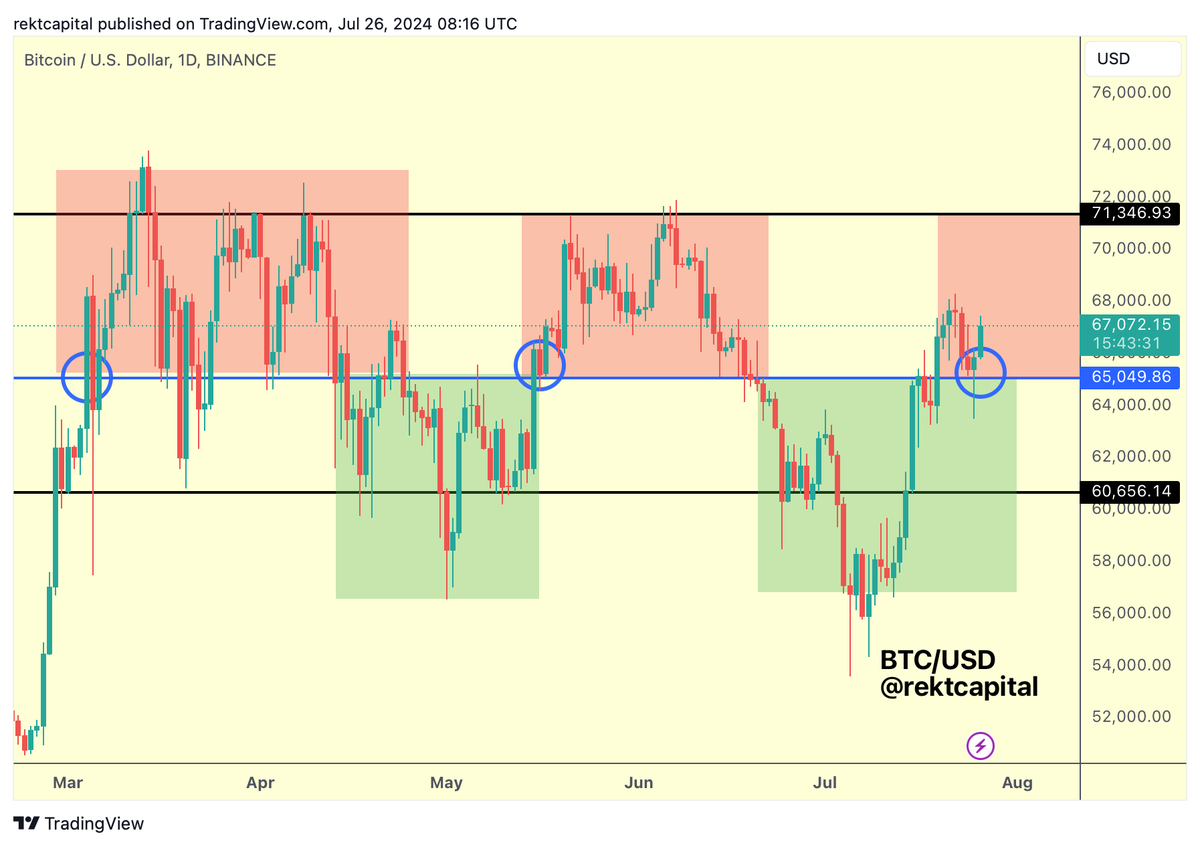
Bitcoin needs to hold strong above $65,000, according to crypto analyst Rekt Capital. He said that:
“The retest was successful. Bitcoin has confirmed $65,000 as support. Price will now continue to occupy the $65000-$71500 region (red).”
Another positive sign is the inflow into Bitcoin ETFs that saw $31.1 million yesterday. At press time, Bitcoin was trading at $67,380, a slight increase of 0.03%.
The Bollinger Bands mark the price range between $68,311 and $64,800 as Bitcoin keeps trying to break above the midline, which aligns with the 50-period moving average (MA) at $66,133.

This midline is a dynamic support/resistance level. A sustained move above this line, with growing momentum, will bring more bullish action.
On the other hand, the lower Bollinger Band at $64,800 is a critical support. Falling below this could signal a bearish reversal or consolidation. So is the 200-period moving average (MA200) at $65,682.
But the proximity of the MA50 and MA200 lines hints at a ‘golden cross,’ where the short-term MA crosses above the long-term MA, a bullish sign.


