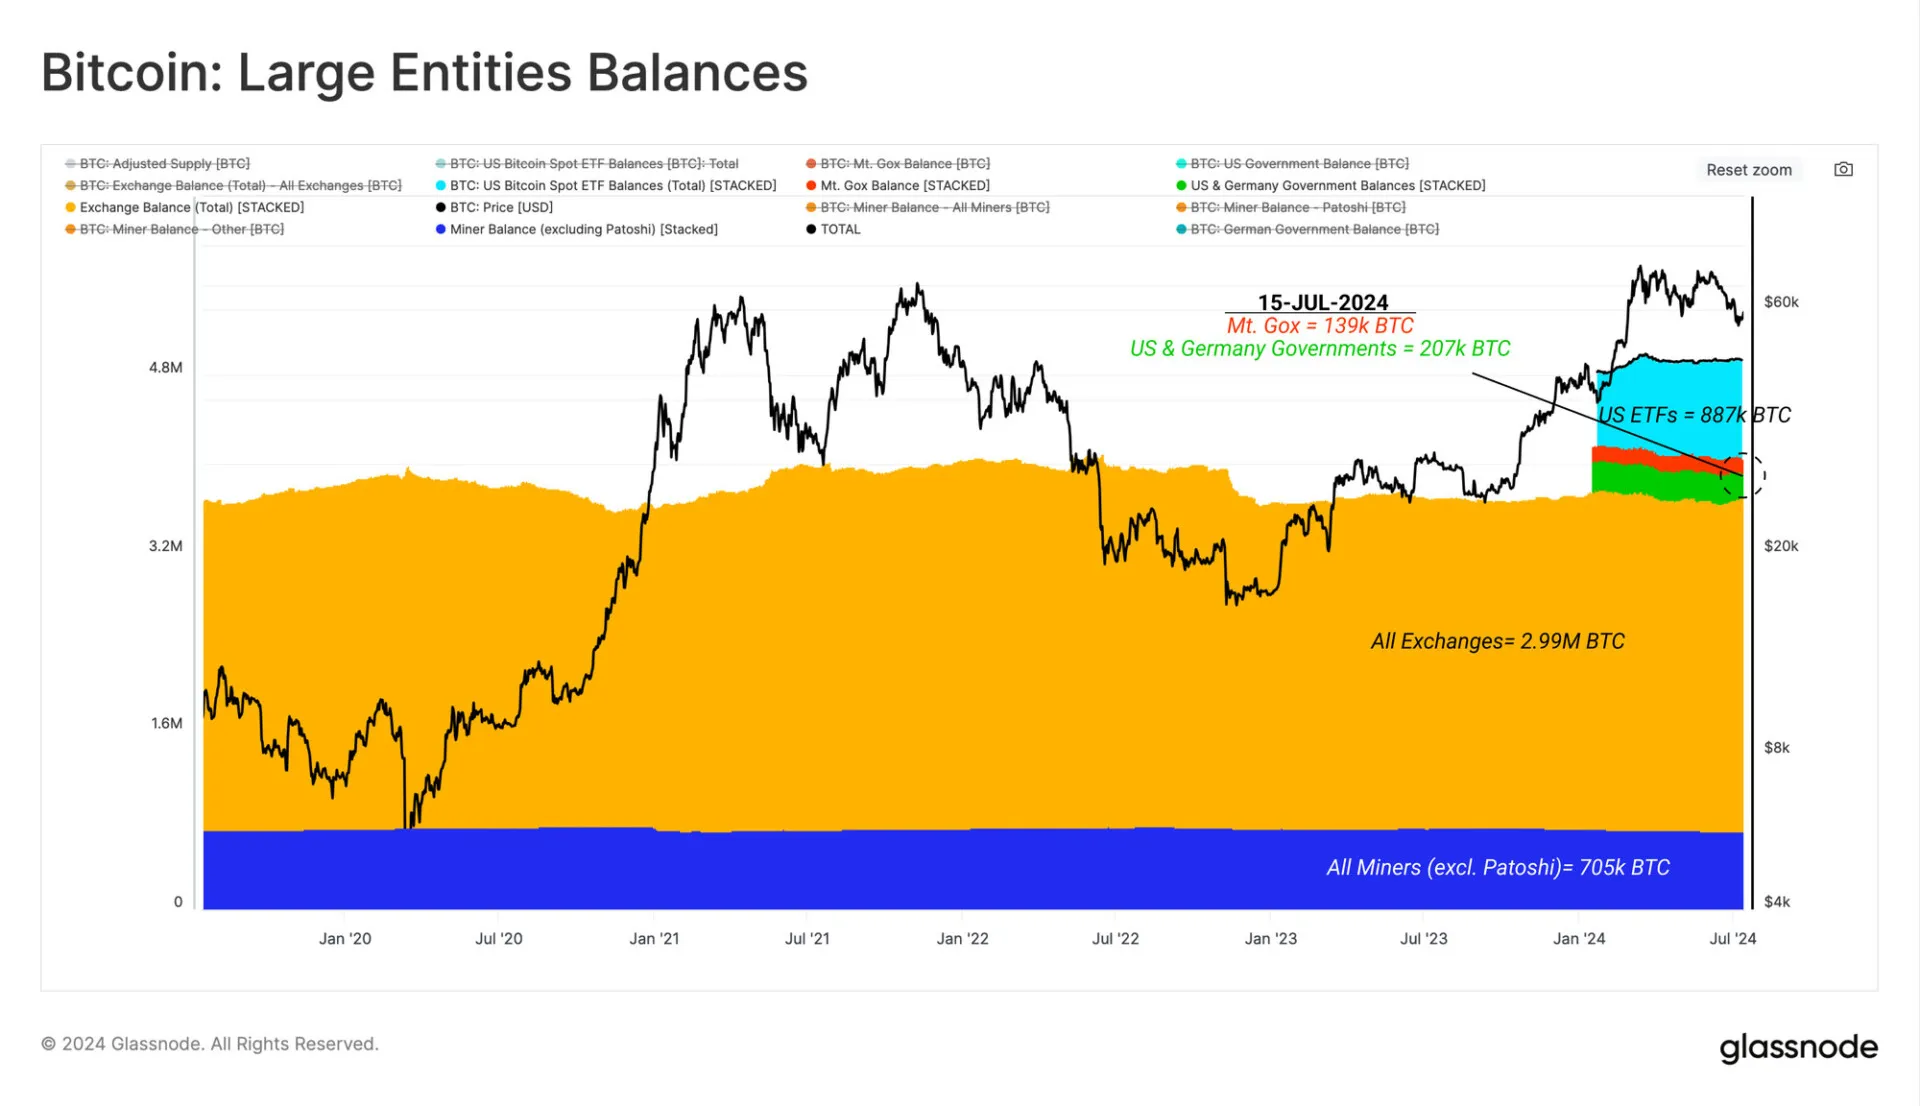
Bitcoin miners don’t sway the market as much as you think. According to Glassnode, miners’ influence has dwindled. They’re now overshadowed by big holders like centralized exchanges, ETFs, and governments.
Miners don’t run the show anymore
Over time, entities like the Mt. Gox trustee have held large amounts of Bitcoin, especially after the exchange’s collapse. We’ve also seen governments seize a lot, selling them off in batches.

Recently, institutional-grade custodians and ETFs have joined the game. Eleven new US spot ETFs together hold over 887,000 BTC, making them the second-largest pool after centralized exchanges, which hold about 3 million BTC.
Miners used to be a big deal, creating lots of sell-side pressure. But with every Bitcoin halving event, their role shrinks a little bit.
In the last 12 months, miner netflows showed a typical balance change of around ±500 BTC per week. Compared to the net deposits and withdrawals of centralized exchanges and ETFs, which see swings of about ±4,000 BTC, miners’ impact looks tiny.

Now elevated sell-side pressure from miners usually happens during periods of price volatility. But ETF outflows have dominated since the market hit a new all-time high in March, largely thanks to GBTC.
Then Germany came in with the big guns, though most of their outflows happened after Bitcoin prices dropped to $54,000 because the market was anticipating that.
The chart above shows that since Bitcoin reached its $73,000 all-time high, miners’ sell-side pressure has been small. Centralized exchange deposits remain the largest and most consistent source of sell-side pressure.
The stability and the speculation
Bitcoin trading has seen some choppy, range-bound action lately. ETFs experienced a period of outflows as prices dropped below the average inflow cost basis of $58,200.
But there’s good news. ETFs saw over $1 billion in total inflows last week, the highest level in many weeks. After the all-time high was broken, there was a noticeable drop in exchange flows, with Bitcoin volumes stabilizing around $1.5 billion per day.
Ethereum, on the other hand, hasn’t seen as much interest compared to the 2021 bull cycle. Not even close. Back then, daily Ether exchange flows were almost as large as Bitcoin’s, but not anymore.

As Bitcoin’s price dropped to a local low of $53,500, about 25% of the coin supply held an unrealized loss. This brought the Percent Supply in Profit metric down to its long-term average of 75%, a level typically seen during bull market corrections.
Glassnode found that short-term holders took a hard hit, with over 66% of their supply moving into an unrealized loss in just a month, one of the largest drops in STH profitability ever recorded. These holders’ average cost basis is around $64,300.
Long-term holders (LTH), however, have barely felt a pang in their profitability. Investors from the 2021 bull market are still holding strong. They aren’t easily swayed by these market fluctuations since they’ve been through worse.

Glassnode also looked at exchange inflows of BTC and ETH as indicators of sell-side pressure, comparing these to stablecoin inflows, which represent demand. Values near zero means neutral, where buy-side inflows match sell-side pressure.
Positive values mean there is a net buy-side, while negative values means net sell-side. Since mid-2023, the market has been in a net sell-side regime, but this has been decreasing over the past few months.

The spot cumulative volume delta (CVD) metric proves this. Since the all-time high in March, sell-side dominance has been clear. But last week, the CVD recorded the first net-buy-side since July. This means the sell-side pressure has softened.


