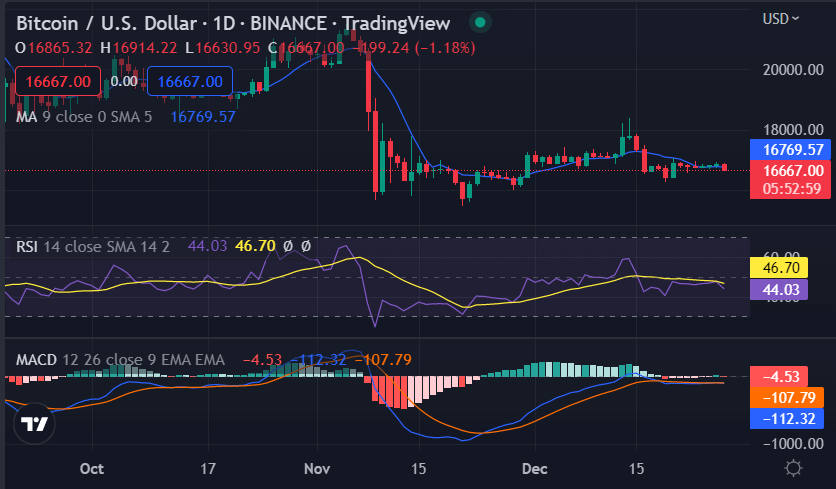
Bitcoin price analysis indicates the digital asset has been in a downward trendline over the last few hours. The price of the asset is trading at $16,788, which is down by 0.40 percent in the last 24 hours. The recent analysis of the BTC market indicates that Bears are pushing the downtrend, demoting the asset further down.
In the short term, the bearish momentum is expected to continue. The major resistance level for the BTC price is $16,959. If the Bears continue to dominate the market, a further decrease in price is likely. However, if the BTC price pumps above $17,000, the asset may see a reversal of fortunes.
Bitcoin price analysis on an intraday chart: Range-bound movement is likely
From the Bitcoin price analysis on an intraday chart, it can be observed that the BTC prices have been consolidating between $16,762 and $16,959 over the last few hours. The digital asset is presently trading at $16,788 and is likely to remain range-bound for some time. From the Bitcoin price analysis on a daily chart, it can be observed that the BTC price has been in a continuous uptrend since the beginning of today. However, the recent bearish push has stalled this uptrend and is likely to lead to further decreases in price if Bears continue to dominate the market.

The RSI (relative strength index) indicator on the intraday chart is presently at 46.70 and it indicates that the digital asset is in the oversold zone. The MACD (moving average convergence divergence) indicator on the intraday chart is presently in the bearish zone but it is close to the centerline. The 50-day moving average on the daily chart is presently at $16,667, which indicates that the asset has a lot of room to go before it reaches its major resistance level, while the 200-day moving average is at $16,769.
Bitcoin price analysis on a 4-hour price chart: Bearish trendline intact
The Bitcoin price analysis on a 4-hour time frame reveals that the bears are increasing their grip on the market after forming a descending triangle pattern. The digital asset is presently trading at $16,788 and is in the process of testing its support level at $16,762. The bullish asset is likely to be hindered by the descending triangle pattern.

The RSI (relative strength index) indicator on the 4-hour time frame remains in the oversold zone with a reading of 49.15, while the MACD (moving average convergence divergence) indicator is also in bearish territory and is presently close to the centerline. The 50-day moving average is presently at $16,664 while the 200-day moving average is at $16,794.
Bitcoin price analysis conclusion
In conclusion, the Bitcoin price analysis on an intraday chart and a 4-hour time frame reveals that the digital asset is likely to remain range-bound for some time. However, the asset is likely to face bearish pressure if the Bears continue to dominate the market.


