Bitcoin price analysis shows BTC’s bullish momentum has continued across the past week as buyers re-emerged to push BTC towards fresh yearly highs. At the time of writing, Bitcoin has traded around $17,500 – consolidating above this price level for the first time in a month. Bitcoin is trading at $17,384.50, up by 0.32 percent in the last 24 hours.
Bitcoin opened the daily trading session trading at an intraday low of $1,330.3 and the current day’s high of $1,538.2. Bitcoin has managed to stay well above the psychological support level at $16,500 and continues to trade sideways in a narrow trading range. Bitcoin’s trading volume has dropped over the week, however, traders are adamant to flip this market from bearish to bullish.
On the technical side, Bitcoin is facing strong resistance at $17,800. A bearish divergence on the daily MACD histogram suggests that a break above this level will be difficult as buyers could struggle with selling pressure. On the downside, Bitcoin’s support is present at $16,500. A break below this level could see BTC pull back to the 50-day moving average of around $15,000.
Bitcoin price analysis on a daily chart: Bulls defend the psychological $17,000 support level
The daily chart shows that Bitcoin is trading between the upper and lower Bollinger Band. The Stochastic RSI indicator has moved above the 80-level – a sign of overbought conditions. If bears manage to break below the lower band, Bitcoin could experience further downside pressure.
On the upside, the $17,800 resistance level still needs to be broken for buyers to flip this market from bearish to bullish. If Bitcoin can manage to break above this level, it could open up a path toward highs of $20,000. Bitcoin price analysis on a daily timeframe indicates BTC is starting to form a symmetrical triangle, which suggests that a breakout could be imminent. A break above the upper trendline at $17,800 would indicate further bullishness and traders could start eyeing higher levels around $20,000.

The moving averages are providing good support, with the 50-day moving average at $16,200 and the 100-day moving average at $17,053. A break below these levels would be a bearish signal and could see Bitcoin pull back toward the 200-day moving average of around $14,400. The MACD line and the RSI are both trending upwards, suggesting that buyers have the upper hand. A break above $17,800 would confirm a bullish momentum and could see Bitcoin test new highs.
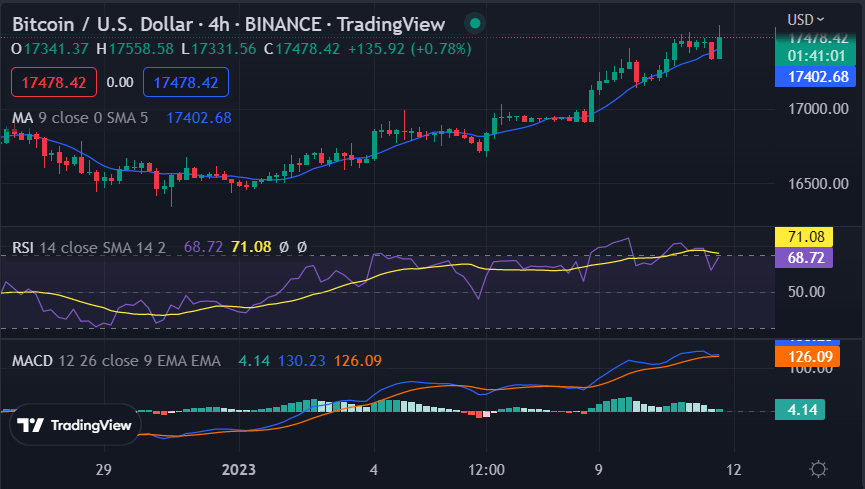
Bitcoin price analysis on a 4-hour chart: BTC consolidates above $17,500
Bitcoin price analysis on a 4-hour chart indicates the volatility has decreased as the traders wait for an expected breakout. BTC is currently trading above the 20-day moving average, which has provided strong support over the past week. The MACD line and the RSI are also bullish and suggest that buyers have regained control of the market.
The nearest resistance level is at $17,800, however, a break above this level could result in further upside pressure. The Chaikin Money Flow index shows the flow of money into Bitcoin is strong and could indicate that buyers are looking to push the price higher despite the current dormancy.

The key support level for Bitcoin is at $17,200 and if BTC can stay above this price level, it could open up a path toward the next resistance level at $18,000. A break below this level would be bearish and could push BTC back down to the previous low at $16,500. Thus, Bitcoin price analysis on a daily and 4-hour timeframe suggests that BTC is consolidating above the $17,500 level as buyers and sellers await an expected breakout.
Bitcoin price analysis conclusion
Bitcoin price analysis sums up that BTC’s recent mini-rally has slowed down in the last few hours as the sideways trading range persists. However, technical indicators are still bullish and suggest that buyers have regained control of the market. The key resistance level is at $17,800 and a break above this level could see BTC retest new highs around $20,000.
While waiting for Bitcoin to move further, see our Price Predictions on XDC, Cardano, and Curve


