The Bitcoin price analysis indicates a notable drop in price over the past few days. The BTC coin is currently trading at around $26,876, with a notable drop of 0.77 percent in the past 24 hours. The BTC token opened today at $27,020 and quickly started retesting below $27k before heading downwards.
The bearish trend of the Bitcoin price analysis is probably due to the fact that investors are withdrawing their funds due to the increased volatility in the market and uncertainty caused by the pandemic. The selling pressure is escalating as the market sentiment is overwhelmingly bearish. The support level at $26,827 is seemingly not enough to contain the sell-off, and the BTC token is likely to break below this level in the near future.
Bitcoin price analysis 24-hour chart: BTC is on the brink of a breakdown
The Bitcoin price analysis 24-hour chart shows an overall weak trend in the BTC price analysis. The bulls were seen on the market earlier today week and reached a day high of $27,265 but quickly started to decline as the bears operated heavy selling pressure.
The market cap plummeted to around $521 billion, with a strong loss of 0.70%. It appears that the buyers are still not able to gain any traction, with the selling pressure clearly dominating the market. However, the trading volume is still high at $8.23 billion, with a gain of 17 percent.
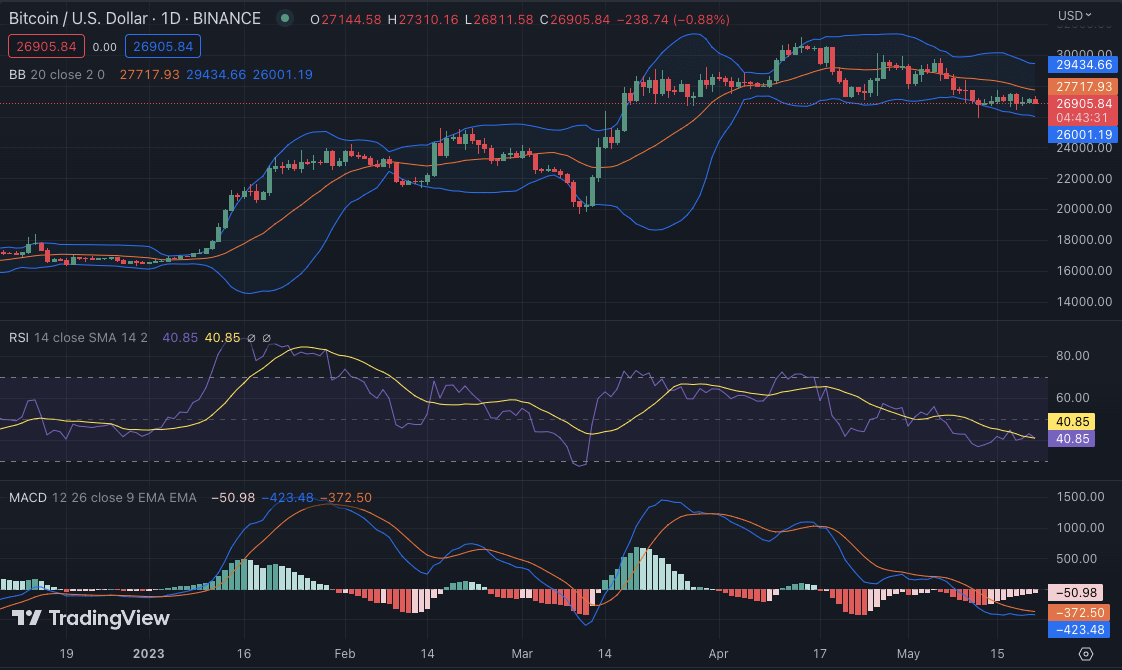
The Relative strength index (RSI) is currently at 34.78, falling below the 50-neutral zone, indicating that the bears are still in control of the market. The MACD chart is also bearish as it shows a growing bearish divergence, and the 24-hour simple moving average (SMA) is still on a downward trajectory. The Bollinger Bands are also close together, indicating low levels of volatility in the market. The lower Band is at $26,739, and the Upper Band is at $27,213.
BTC/USD 4-hour chart: Massive drop results in price backsliding below $27,000
The 4-hour chart for the Bitcoin price analysis shows a massive drop over the past few hours as the BTC token slides down below the key resistance of $27,265. This indicates that the selling pressure has increased, and there is no sign of bearish exhaustion yet.

The MACD indicator on the daily chart is also bearish, with the MACD line crossing below the signal line and further extending its downward trajectory. Additionally, the current price is below the moving average indicator at 26,987, as the 50-day MA and 200-day MA are both heading downward. The Lower Bollinger Band is currently at $26,739, and the Upper Bollinger Band is at $27,213, indicating low levels of volatility in the market. The RSI is currently at 34.78, further indicating that bears are in full control of the market now, and this trend is likely to continue unless there is some bullish signal in the market.
Bitcoin price analysis conclusion
The Bitcoin price analysis confirms that the chances are standing high for further decline. The bears have been leading continuously, and this trend is to follow in the coming time period as well. The price is situated in the danger zone and has receded past its support level of $26,827.
While waiting for Bitcoin to move further, see our Price Predictions on XDC, Polkadot, and Curve