The latest Bitcoin price analysis shows that the bulls have regained control of the market after a sharp pullback. The BTC/USD pair has been able to close above the key support level of $27,000. The bulls are trying to push the price up toward the next resistance level of $28,000. If they succeed in breaking through this level, it could signal an extended rally in the Bitcoin market.

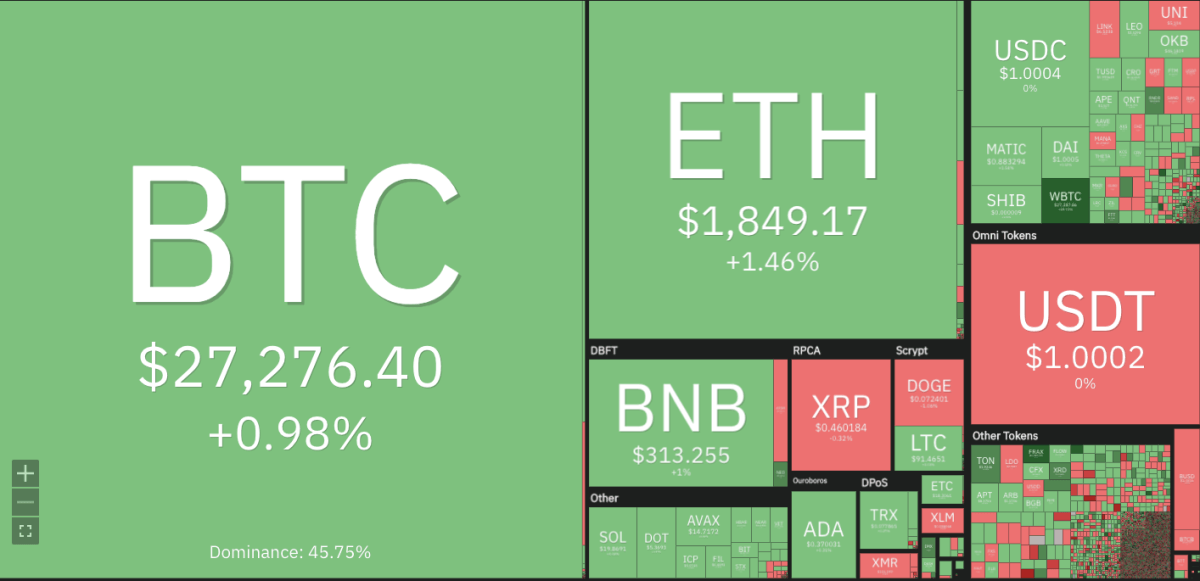
The market opened today’s session with bullish sentiment, and the bulls have been able to keep the momentum going. The bullish trend is currently dominating the BTC market, with price trading around the $27,76 level, with a surge of over 0.98% in the past 24 hours.
Bitcoin price analysis 24-hour chart: BTC upgrades to $27,276 after bullish efforts
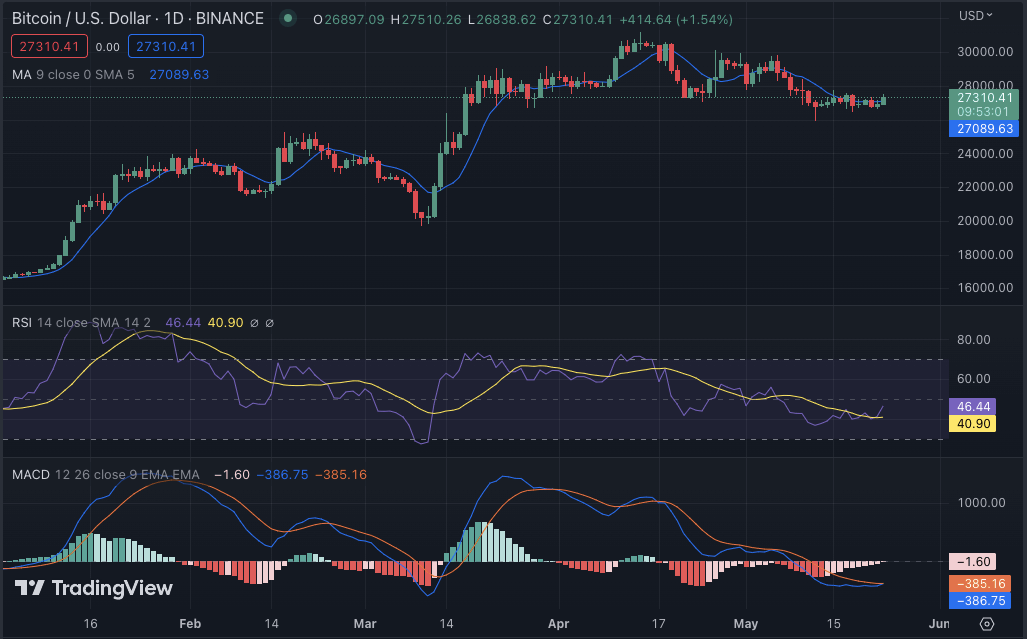
The daily Bitcoin price analysis shows a bullish trend, as the buying activity has been on the rise for the past 24 hours. Bullish momentum has taken the price above the $26,714 support level as an upward wave dominates the market. As the bulls are in the driving seat, the price trends are going in favor of the buyers.
BTC’s market capitalization and 24-hour trading volume increased by 1.91% and 46.19%, respectively, to $528,740,132,311 and $14,133,822,549. This spike indicates that there is still substantial demand for BTCs in the market, and investors are actively trading the cryptocurrency despite its extreme volatility and hazards.

The technical analysis suggests BTC price is in a bull’s grip, and the probability of the 200-day EMA breakout remains high. However, the price will gain momentum when buyers are able to sustain the $28,000 hurdle. Technical indicators like MACD had generated a positive crossover indicating bullish momentum to continue for some more time. The RSI at 46.44 denotes the strength of bulls, and more room for upside is open.
Bitcoin price analysis: Bulls continue to recover as more gain is expected
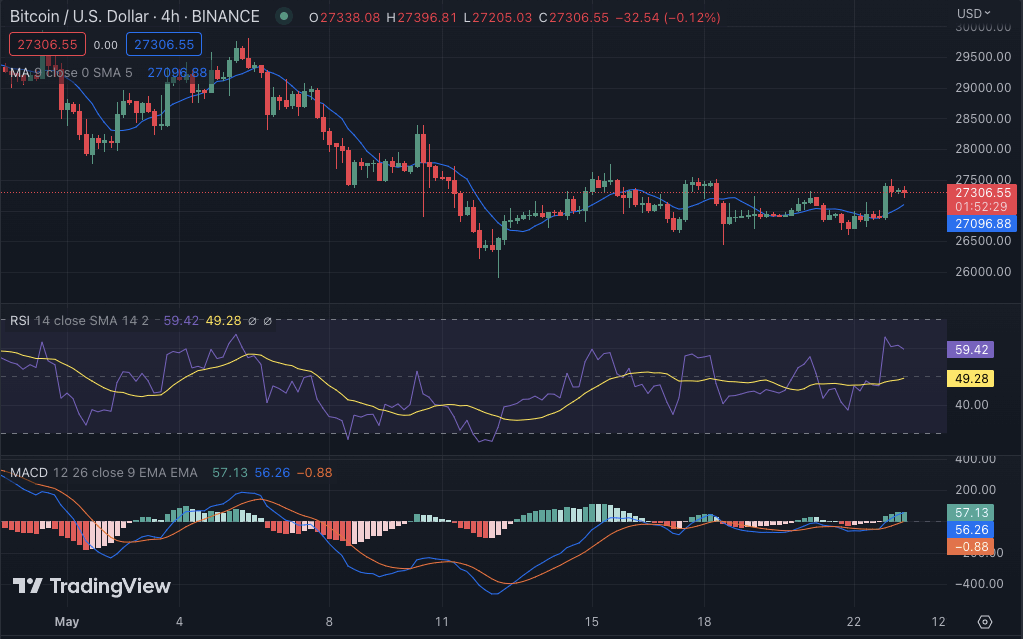
The four-hour Bitcoin price analysis confirms an increasing trend as the price covers range upwards from the start of the trading session as the green candlesticks indicate a rise in coin value. The bullish momentum has successfully rescued the price above the $27,000 margin, and it seems like the bulls are going to achieve their next target soon.

The moving average in the four-hour price chart is trading at 27,096 positions, and the 50-day MA is at $27,175. The relative strength index is staying at 59 levels, depicting an overbought situation. The MACD analysis keeps on showing bullish crossovers, with a signal line trading above the MACD line in the positive zone. The green histograms are expanding, illustrating the presence of buying pressure.
Bitcoin price analysis conclusion
Overall, Bitcoin price analysis is trading in a bullish zone, and there are chances that it could reach its next resistance at $28,000 soon. The market will remain volatile due to the presence of institutional investors, so crypto traders should be conscious before investing or making any kind of transaction. If bears manage to come back, the key support levels at $26,714 and $25,000 could be tested.
While waiting for Bitcoin to move further, see our Price Predictions on XDC, Polkadot, and Curve


