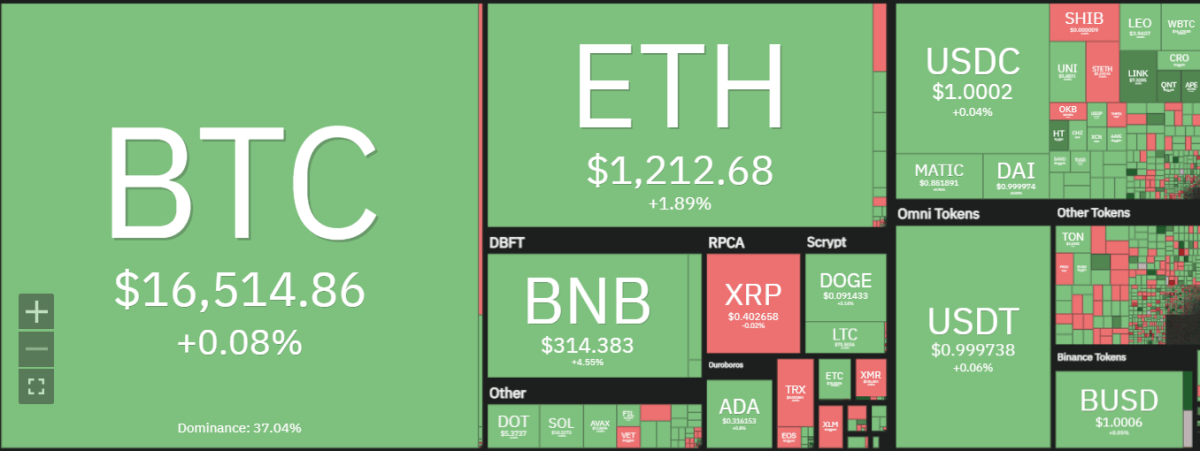
Bitcoin price analysis shows that BTC/USD has been trading in a sideways consolidation range. The price of bitcoin reached a high above $16,000, but since then it has been trading in a tight consolidation range between $15,900 and $16,200.Bitcoin is trading at $16,518.38 after trading in a tight range over the past couple of hours. The charts show a bearish bias with support at $16,000 and resistance at $17,500.

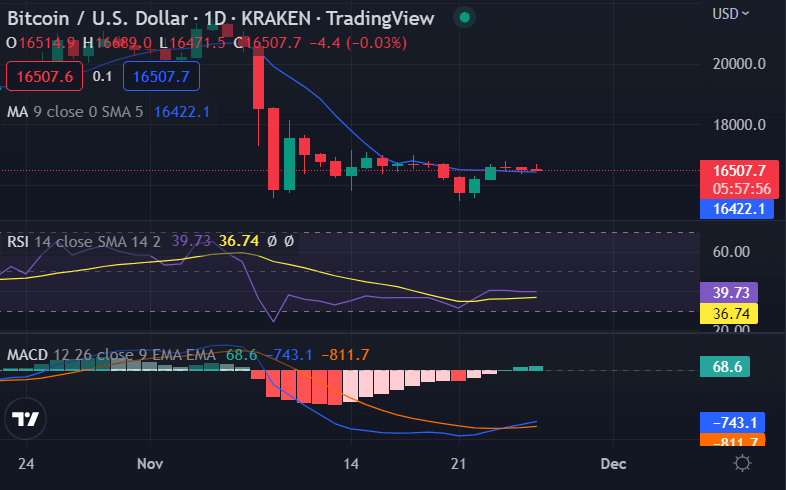
Bitcoin price analysis on a daily chart: BTC price holds above $16,500
Bitcoin price analysis on a daily chart shows the bears and the bulls have been holding the price in a tight consolidation range above $16,500. BTC/USD is holding current levels as there are signs of the bulls retaking control.
On the daily chart, Bitcoin price has been trading largely sideways over the past couple of hours and has failed to break through resistance at $17,000. Support on the downside lies at $16,000 and $15,500. On the upside, there is a potential for further gains to $17,500 in the short term.

There are signs that bitcoin prices may be starting to trend upward, as technical indicators on the daily chart are showing positive momentum and support for higher prices. The Stochastic RSI is currently moving in an upward direction, while the MACD remains flat. For these reasons, we believe that bitcoin prices may continue to climb over the next few days.
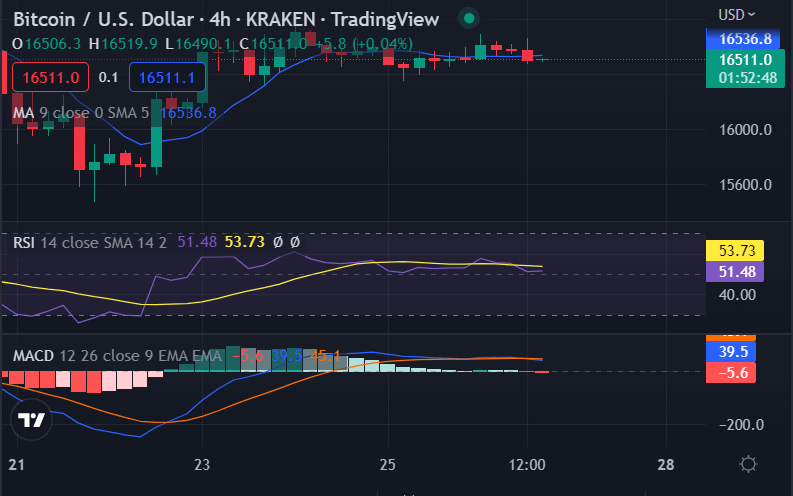
Bitcoin price analysis on a 4-hour chart: Bears and bulls fight for control
Bitcoin price analysis on a 4-hour chart shows that the bears and the bulls are currently fighting for control, as BTC/USD trades in a sideways consolidation range. The bulls have been stumbling to break through resistance at $16,500, but we believe that they may start to gain ground soon.
On the 4-hour chart, bitcoin price has been trading in a tight consolidation range over the past couple of hours as both bears and bulls have struggled to establish control.

The 50 MA is currently trending higher, while the 100 MA is flat. Additionally, technical indicators on the 4-hour chart are mixed, with the Stochastic RSI moving in a sideways direction and the MACD momentum oscillator continuing to move lower.
The Relative Strength Index (RSI) is at 54, indicating that bitcoin prices are still in a neutral zone. Based on these factors, we believe that bitcoin may continue to trade sideways over the next few hours before potentially breaking out of the consolidation range.
Bitcoin price analysis conclusion
Bitcoin price analysis suggests that BTC/USD is currently in a sideways consolidation range, with both bulls and bears fighting for control. However, we believe that the upward momentum may gain ground soon, as technical indicators show signs of an impending breakout. In the short term, support can be found at $16,000 and $15,500, while resistance lies at $17,500.
Disclaimer. The information provided is not trading advice. Cryptopolitan.com holds no liability for any investments made based on the information provided on this page. We strongly recommend independent research and/or consultation with a qualified professional before making any investment decisions.


