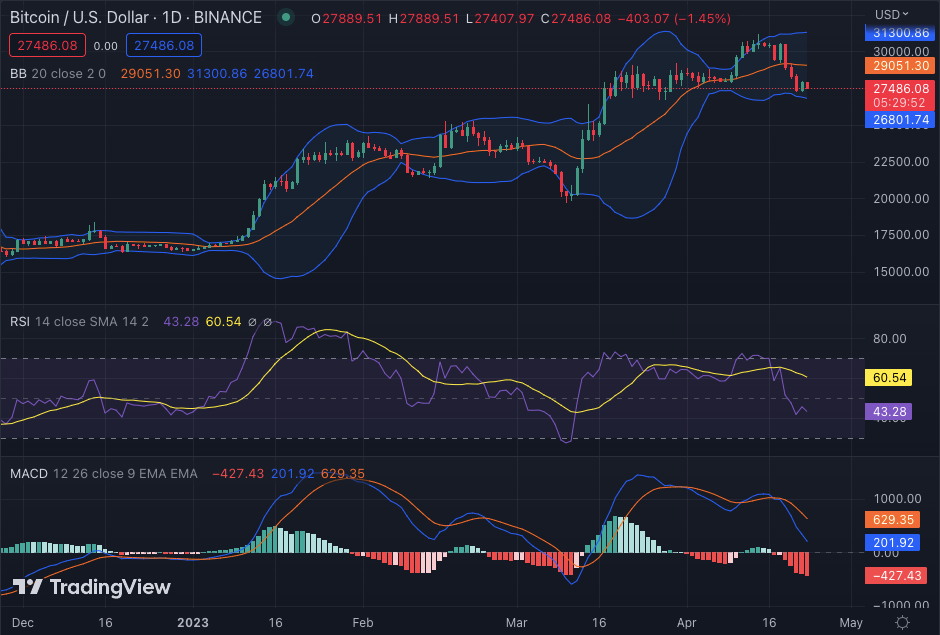
The Bitcoin price analysis reveals the cryptocurrency is continuing the downslide. The last few days have seen a significant drop in the price of Bitcoin, with the price falling from $31,000 to a low of $27,592. The decline was triggered by selling pressure in the market and a lack of buying demand to support prices.
The current resistance for Bitcoin (BTC) is at $27,872, with a loss of 0.56% in the last 24 hours. The BTC has traded in a range bound of $27,400 to $27,872 in the past 24 hours, indicating bearish momentum. The trading volume for the token has dropped to $12.81 billion in the past 24 hours, which is down by 20.65 per cent while the market cap of Bitcoin stands at $531 billion.
Bitcoin price analysis 24-hour chart: BTC price trades below $28,000 as bearish momentum persists
The 1-day Bitcoin price analysis shows that a further decrease in the price has been noted again today as the price has devalued to $27,592 at the time of writing. BTC/USD pair opened today’s trading session at $27,644, and since then, it has continued to decline. The support level for the pair is at $27,404, and if the price breaks below this level, then it may go further lower. On the upside, the resistance level is at $27,872, which was tested multiple times, but the price failed to break above this level.

The Moving Average Convergence Divergence (MACD) shows that the bearish momentum is continuing as the MACD line has crossed below the signal line, indicating a bearish crossover. The Relative Strength Index (RSI) is in neutral territory at 43.28, as the RSI line is hovering around the 50-level. The Bollinger bands on the chart have been squeezed, which indicates a low in the market. The upper Bollinger band is at $31,300 and the lower Bollinger band is at $26,801.
Bitcoin price analysis: Recent developments and further technical indications
The 4-hour Bitcoin price analysis indicates that the bearish momentum has resulted in a further decline in the price value. The price has dropped to $27,592, as the trend has remained bearish for today. However, bullish traces can also be seen on the hourly chart, as bulls tried to provide support for the price but still, the selling pressure is there in the market.

The volatility in the market is also increasing, which can be seen in the Bollinger bands. The upper Bollinger band is at $28,624 and the lower Bollinger band is at $26,997, indicating that the market is volatile. The Relative Strength Index (RSI) has also decreased to 33.65, indicating a downtrend in the market and further bearish momentum. The moving average convergence divergence (MACD) is also in the bearish zone, with the MACD line below the signal line, indicating a sell signal.
Bitcoin price analysis conclusion
Bitcoin price analysis shows that the cryptocurrency is facing bearish momentum in the market and it looks like this trend will continue. The price is currently trading at $27,592 and the selling pressure is still present in the market. The resistance level for the BTC/USD pair is at $27,872 and if the price breaks above this level, then it may go further higher. On the downside, the support point is at $27,404, and if the prices dip below this level, then they may continue to decline further.


