Bitcoin price analysis shows the bears have won the day after a period of consolidation of around $16,500.Bitcoin reached an intraday high of $16,663, but slowly fell toward $16,500 and tested it as support. However, during the last few hours, Bitcoin’s price movement has been battered and is looking for a clear direction. Bitcoin is trading at $16,428.38, with a decline of 0.81 percent at the moment of writing.
With the bulls’ failed attempt to break $17,000 and consolidate above $16,500, Bitcoin is likely to face more resistance near $17,000. If BTC manages to stay above the support at $15,500 it might push back up to retest its previous weekly peak of $16,789.98.
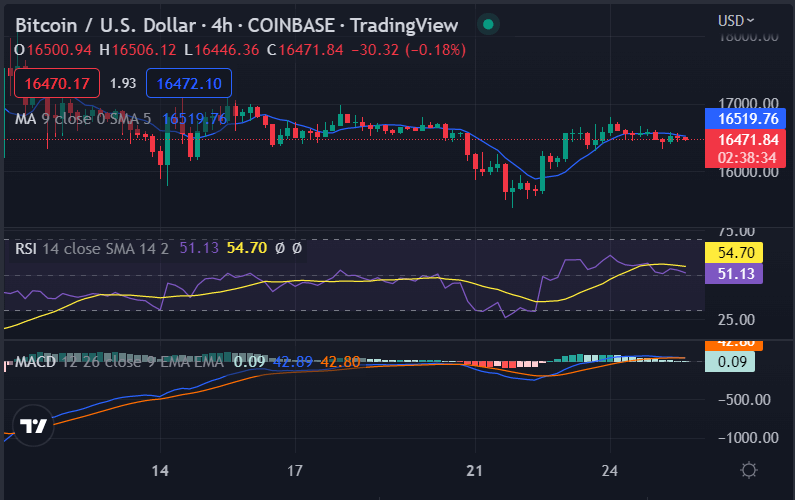
Bitcoin price analysis on a 4-hour chart: Sideways movement has ended, BTC likely to fall lower
The 4-hour chart shows that a short consolidation period has come to an end. Bitcoin is likely reported its support of $15,500 and may take the next leg down towards $14,000 before making another rally. The MACD indicators show that the bears are gaining control over this market, with the MACD line making a bearish crossover of the signal line below -0.03.
The RSI indicator is at 40.3, near the bottom of its range, showing some weakness in this market trend and revealing that more downward momentum could be expected in Bitcoin’s price in the coming hours.

The moving average line is also pointing to a bearish market trend, with the 20-MA below the 50 and 100-MA. The 3-day chart is described using trend lines to connect with two lower highs and three lower lows. The third retest of the lower trend line is still in play as BTC hovers around $16,500. The market volatility has been relatively low as the Bollinger bands are closing in during the last few hours.
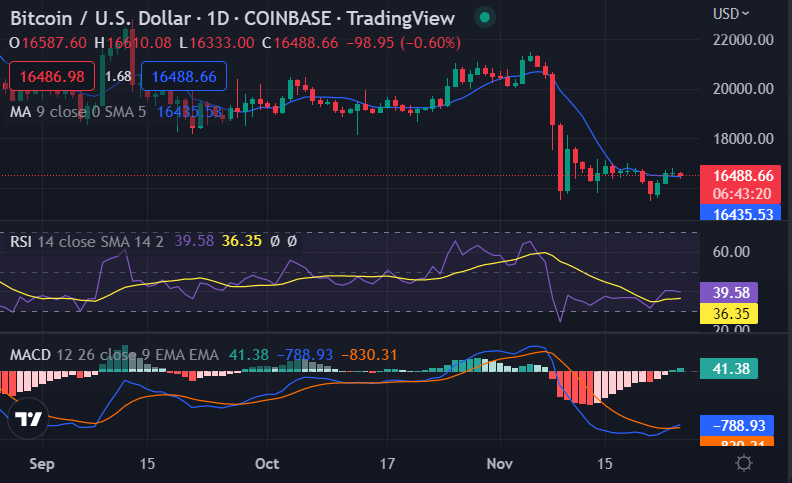
Bitcoin price analysis on a daily chart: Lower highs and lower lows
Bitcoin price analysis on a daily timeframe shows the cryptocurrency has been fluctuating around the mid $16,000 level. The RSI indicator is at 37.2, indicating oversold conditions in the market because the volume has been tapering off. The daily chart also shows that Bitcoin’s price is trading near its support line at $15,700 after falling from its recent high near $17,000.

Based on the daily chart, it is likely that the price will continue to fall and test the support line at $15,700 before attempting a short-term rally or moving sideways in this range until around mid-December.
The current market sentiment is bearish as evidenced by the MACD line making a bearish crossover of the signal line below -0.03 and the Stochastic RSI indicator is pointing to a near-term downward momentum. Bitcoin price analysis shows the bears have won this round and are now in control of the market, making it likely that there will be more bearish pressure in the coming hours. Bitcoin is also facing resistance at $16,700 and $16,500, so any move higher from this point will be short-lived and likely result in a return to the lows at $15,500.
Bitcoin price analysis conclusion
Our Bitcoin price analysis sums up the bearish tone in the market as participants are still adjusting to the new norm of lower highs and lows after Bitcoin broke through $16,500. Bitcoin’s price could head back down to $16,020, where there is more support. For a moment, it looked like the holiday rally would be strong enough to break past the red descending trend line and keep going until it reached $20,000. But now it looks like BTC will just slowly decrease in value toward $15,500 without any big sell-offs.
After the failed rally above $17,000 and its failure to break down below $15,500, Bitcoin price has been consolidating with lower highs and higher lows. This is indicative of market indecision about where the value of this asset should be for the time being.
Disclaimer. The information provided is not trading advice. Cryptopolitan.com holds no liability for any investments made based on the information provided on this page. We strongly recommend independent research and/or consultation with a qualified professional before making any investment decisions.


